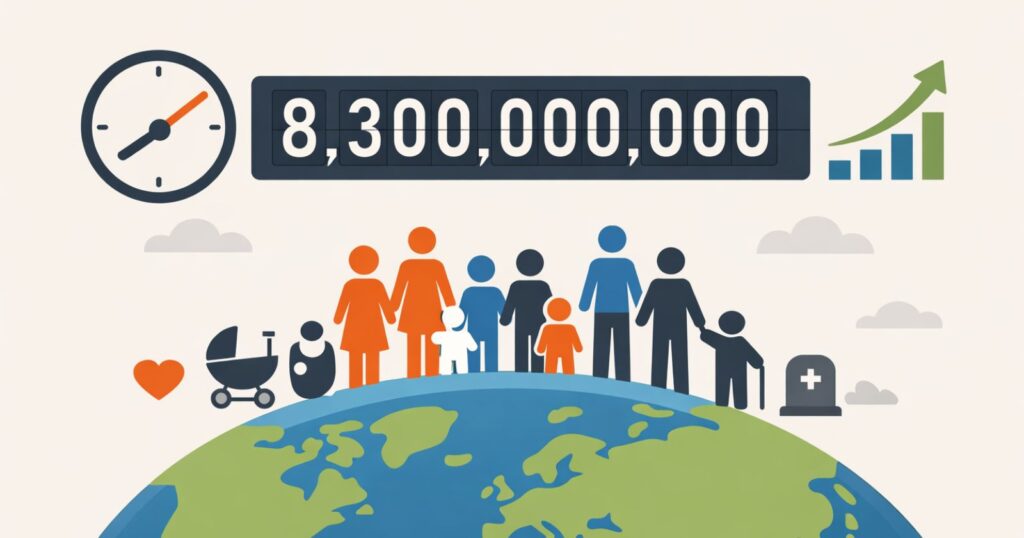
As of mid-2026, roughly 8.3 billion people call planet Earth home. That number is not a fixed figure frozen in time; it is a constantly shifting tally, climbing every second as new babies are born and falling, just as steadily, as lives come to an end. Depending on which agency you check, you might see slightly different numbers. Worldometer’s live counter, the United Nations Population Division, the World Bank, and independent demographic trackers all publish estimates that hover close together but rarely match exactly, and that is by design rather than error.
These small discrepancies exist because no two organizations use identical input data, update schedules, or interpolation methods. Some rely on the latest national census results, others lean on birth and death registries, and many fill gaps with statistical modeling where record-keeping is incomplete. What every credible source agrees on, however, is the broader story: humanity has passed the 8 billion mark, growth is continuing but decelerating, and the demographic center of gravity is shifting firmly toward Asia and Africa.
Tracking the world population matters far beyond academic curiosity. Governments use these figures to plan infrastructure, healthcare systems, and food security strategies. Businesses use them to forecast markets. Climate scientists use them to model resource consumption and emissions trajectories. Understanding where the global population stands today, and where it is heading, offers a window into the economic, environmental, and social challenges that will define the coming decades.
This article breaks down everything you need to know about the world population in 2026, from real-time estimates and historical milestones to country rankings, regional trends, fertility patterns, aging populations, and projections all the way out to the year 2100.
World Population 2026 at a Glance
Before diving into the details, here is a snapshot of where global demographics stand right now.
Key Global Population Statistics (2026)
| Metric | Value |
|---|---|
| World Population (mid-2026) | ~8.30 billion |
| Annual Population Growth | ~69–72 million people/year |
| Daily Births | ~123,000 |
| Daily Deaths | ~51,000 |
| Net Daily Increase | ~72,000 people |
| Growth Rate | ~0.83–0.84% per year |
| Median Age | ~31 years |
| Urban Population | ~58% of total |
| Rural Population | ~42% of total |
| Life Expectancy (global average) | ~73.3 years |
These figures represent the consensus mid-point across UN World Population Prospects (2024 Revision) and major demographic trackers. Small variations between sources are normal.
What Is the Current World Population in 2026?
Current World Population Estimate
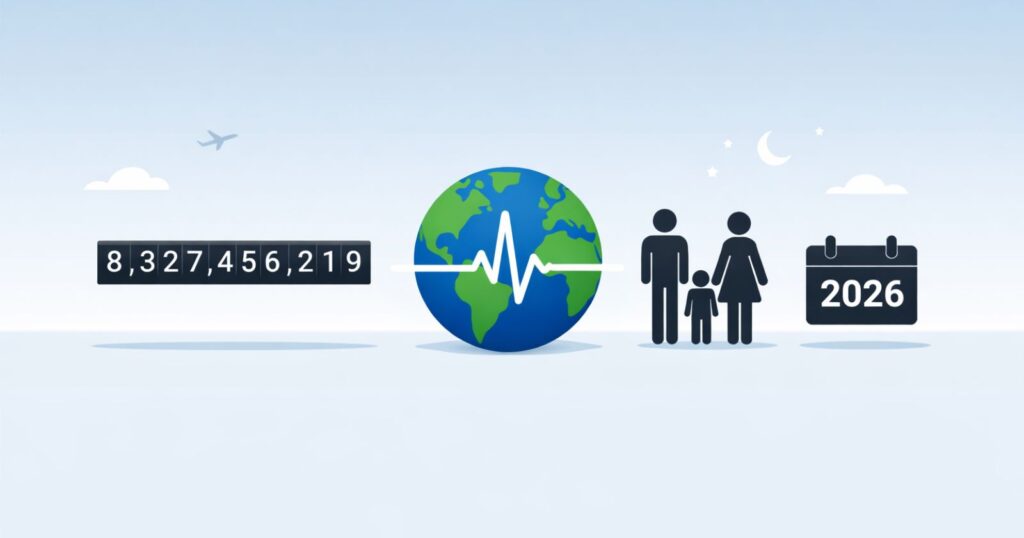
As of June 2026, the global population sits at approximately 8.30 billion people, with most live counters showing figures between 8.28 and 8.30 billion depending on the exact moment and methodology used. This places humanity firmly past the historic 8-billion milestone, which was officially marked by the United Nations on November 15, 2022.
The reason the exact figure shifts every second comes down to simple arithmetic happening at a massive scale. Births are occurring somewhere in the world roughly every 0.7 seconds, while deaths occur roughly every 1.7 seconds. Multiply that across a 24-hour cycle, and you get a population that is never static, even for a moment.
Population Clock Methodology
Population clocks like those run by Worldometer do not literally count every birth and death as it happens; that would be operationally impossible. Instead, they use known annual birth and death rates, applied as a continuous real-time interpolation between official UN reference points. This produces a smooth, second-by-second estimate that tracks closely with reality without requiring impossible real-time global data collection.
Difference Between Estimate and Census Counts
A national census attempts to count every individual in a country at a fixed point in time, but censuses are expensive, infrequent (often conducted only once every 10 years), and logistically difficult in remote or conflict-affected regions. Population estimates, by contrast, use census data as an anchor point and then apply demographic modeling, birth/death registries, and migration data to project forward. This is why “current” population figures are technically educated estimates rather than literal headcounts.
How Population Clocks Work
Real-time population tracking relies on four core inputs:
- Birth calculations — derived from each country’s crude birth rate applied to its population base
- Death calculations — derived from crude death rates and age-structure mortality data
- Migration adjustments — net international migration figures that shift population between countries without changing the global total
- Real-time modeling — continuous interpolation between official UN data points, updated as new figures are released every two years
This system is remarkably accurate at the global level, even though individual country counters can drift slightly between official updates.
Why No One Knows the Exact World Population
It might be surprising, but no government, agency, or organization on Earth knows the precise, real-time population of the planet. Several structural limitations make a truly exact count impossible:
- Census limitations: Many countries conduct censuses infrequently, and some, particularly in conflict zones or politically unstable regions, have not held a reliable census in over a decade.
- Registration gaps: Birth and death registration systems are incomplete in large parts of sub-Saharan Africa and South Asia, meaning vital events go unrecorded.
- Remote populations: Nomadic groups, displaced populations, and people in hard-to-reach geographic areas are routinely undercounted.
- Statistical estimation models: Where direct data is unavailable, demographers use modeling techniques that, while sophisticated, still carry margins of error.
These limitations are precisely why population figures from different reputable sources can vary by tens of millions of people while still all being “correct” within their respective methodologies.
Historical Growth of the World’s Population
Population Through Human History
| Year | Estimated Population |
|---|---|
| 10,000 BCE | ~4–8 million |
| 1 CE | ~200–300 million |
| 1000 CE | ~310 million |
| 1500 | ~500 million |
| 1800 | ~1 billion |
| 1900 | ~1.6 billion |
| 1950 | ~2.5 billion |
| 2000 | ~6.1 billion |
| 2026 | ~8.3 billion |
For most of human history, population growth was glacially slow, constrained by famine, disease, and high infant mortality. It took until around 1800 for the global population to reach its first billion. Everything after that point accelerated dramatically.
Major Population Milestones
| Billion Reached | Approximate Year | Years Since Previous Billion |
|---|---|---|
| 1st billion | ~1804 | — |
| 2nd billion | 1927 | 123 years |
| 3rd billion | 1960 | 33 years |
| 4th billion | 1974 | 14 years |
| 5th billion | 1987 | 13 years |
| 6th billion | 1999 | 12 years |
| 7th billion | 2011 | 12 years |
| 8th billion | 2022 | 11 years |
This table tells a striking story: the gap between each successive billion shrank dramatically through the 20th century, then began stabilizing. The 9th billion is projected for the early-to-mid 2030s, and notably, the gap between 8 and 9 billion is expected to be longer than the gap between 7 and 8 billion, an early signal of decelerating growth.
How Population Growth Accelerated
Several overlapping historical forces explain the dramatic acceleration after 1800:
- The Agricultural Revolution increased food yields and supported larger, more stable settlements centuries earlier, laying the groundwork for sustained population growth.
- The Industrial Revolution improved economic productivity, urbanization, and access to resources starting in the late 1700s.
- Medical advances, including vaccination and antibiotics, dramatically cut mortality from infectious disease starting in the late 19th and 20th centuries.
- Sanitation improvements, such as clean water systems and sewage treatment, reduced deaths from waterborne illness.
- Modern healthcare, including maternal and child health interventions, sharply reduced infant and maternal mortality throughout the 20th century.
Global Population Growth in 2026
Is the World Population Still Growing?
Yes, the global population is still growing, but the rate of that growth has been slowing for decades. The world is adding roughly 69–72 million people annually in 2026, a substantial number in absolute terms, but a much smaller proportional increase than in previous decades.
Current Population Growth Rate
The global growth rate in 2026 stands at approximately 0.83–0.84% per year, down from 0.97% in 2020 and a peak of nearly 2% in the mid-1960s. Demographers project this rate will continue declining, falling to around 0.5% by 2046, and ultimately approaching zero, then turning negative, later in the century.
This slowdown is driven primarily by falling fertility rates worldwide. The global fertility rate has more than halved since the 1960s, dropping from over 5 children per woman to roughly 2.3 today. Despite this decline, the population continues to grow due to population momentum, a demographic phenomenon where a large existing cohort of young people continues having children even as average family size shrinks, sustaining growth for a generation or more after fertility rates drop.
How Many People Are Added Each Day?
| Time Period | Population Increase |
|---|---|
| Per Year | ~70 million |
| Per Month | ~5.8 million |
| Per Day | ~190,000–200,000 |
| Per Hour | ~8,000 |
| Per Minute | ~133 |
Top 20 Most Populous Countries in 2026
Largest Countries by Population
| Rank | Country | Population (approx.) |
|---|---|---|
| 1 | India | 1.46–1.47 billion |
| 2 | China | 1.41–1.42 billion |
| 3 | United States | 340–347 million |
| 4 | Indonesia | 285 million |
| 5 | Pakistan | 260 million |
| 6 | Nigeria | 235 million |
| 7 | Brazil | 220 million |
| 8 | Bangladesh | 175 million |
| 9 | Russia | 144 million |
| 10 | Ethiopia | 135 million |
| 11 | Mexico | 132 million |
| 12 | Japan | 122 million |
| 13 | Philippines | 119 million |
| 14 | Egypt | 117 million |
| 15 | DR Congo | 112 million |
| 16 | Vietnam | 101 million |
| 17 | Iran | 92 million |
| 18 | Turkey | 88 million |
| 19 | Germany | 84 million |
| 20 | Thailand | 72 million |
Together, these 20 countries are home to roughly 70% of all humans on Earth.
Analysis of Leading Countries
India holds the top spot in 2026, having overtaken China in 2023 as the world’s most populous nation. India’s population continues to grow, supported by a relatively young median age and broad geographic and economic diversity, though its fertility rate has fallen close to replacement level in many states.
China, by contrast, has entered a phase of structural population decline. Decades of the one-child policy, followed by persistently low fertility even after its relaxation, mean China’s population is now shrinking each year modestly, with significant long-term implications for its labor force and pension systems.
The United States remains a distant third, with population growth driven primarily by immigration rather than natural increase, since the U.S. fertility rate sits below replacement level.
Indonesia, Pakistan, and Nigeria represent the next tier of demographic weight, each combining large existing populations with continued, comparatively high growth rates, particularly Nigeria, which is on track to become one of the most populous nations on Earth by the latter half of this century.
Population by Continent in 2026
| Continent | Population (approx.) | Share of World Population |
|---|---|---|
| Asia | ~4.8–4.85 billion | ~58% |
| Africa | ~1.5 billion | ~18% |
| Europe | ~741–750 million | ~9% |
| North America | ~600 million | ~7% |
| South America | ~440 million | ~5% |
| Oceania | ~46 million | ~0.5% |
Asia’s dominance is staggering: nearly three in every five people alive today live somewhere on the Asian continent, primarily concentrated in India and China. Africa is the second most populous continent and, critically, the fastest-growing by a wide margin. Europe, meanwhile, has already passed its peak population (reached around 2020) and is now in gradual decline.
Population Distribution Around the World
Where Do Most People Live?
The population is wildly unevenly distributed across the globe. South and East Asia together account for the largest concentrations of humanity, driven by fertile river valleys, historic agricultural productivity, and dense urban development. By contrast, vast stretches of the Sahara, Siberia, the Amazon interior, and Australia’s outback remain almost empty.
Population Density by Region
| Region | Density (People per km²) |
|---|---|
| South Asia | ~390 |
| East Asia | ~135 |
| Western Europe | ~190 |
| Sub-Saharan Africa | ~55 |
| North America | ~25 |
| Oceania | ~5 |
| Global Average | ~60 |
Urban vs Rural Population
How Urbanized Is the World?
For the first time in human history, more people now live in cities than in rural areas. In 2026, roughly 58% of the global population is urban, compared to just 30% in 1950. This trend is projected to continue, with urban populations expected to reach close to two-thirds of humanity by 2050.
Largest Cities in the World (Metro Area Estimates)
| City | Metro Population (approx.) |
|---|---|
| Tokyo, Japan | ~37 million |
| Delhi, India | ~34 million |
| Shanghai, China | ~30 million |
| Dhaka, Bangladesh | ~23 million |
| São Paulo, Brazil | ~22 million |
| Cairo, Egypt | ~22 million |
| Mexico City, Mexico | ~22 million |
| Beijing, China | ~21 million |
| Mumbai, India | ~21 million |
| Osaka, Japan | ~19 million |
Megacities in 2026
A megacity is generally defined as an urban area with more than 10 million residents. There are now over 35 megacities worldwide, up from just a handful in 1950. The fastest-growing urban centers today are concentrated in sub-Saharan Africa and South Asia, including cities like Lagos, Kinshasa, and Karachi, which are expanding faster than infrastructure in many cases can keep pace with.
Birth Rates and Fertility Trends
Global Fertility Rate
The global total fertility rate (TFR) in 2026 stands at approximately 2.3 children per woman, just above the long-term replacement level of 2.1. This masks enormous regional variation.
Countries With the Highest Fertility
Niger, Chad, Somalia, DR Congo, and Mali consistently rank among the highest-fertility nations, with rates often exceeding 5–6 children per woman, driven by limited access to family planning, lower female educational attainment, and predominantly rural, agrarian economies.
Countries With Lowest Fertility
South Korea, Hong Kong, Taiwan, and several Southern and Eastern European nations report fertility rates below 1.0, far beneath replacement level, raising serious long-term concerns about workforce shrinkage and aging.
Why Fertility Rates Are Declining
Several interrelated factors drive the global fertility decline:
- Education: Rising female education levels are strongly correlated with delayed marriage and smaller family size.
- Urbanization: City living tends to reduce the economic incentive for large families that exists in agrarian settings.
- Economic development: As incomes rise and child mortality falls, families have fewer children with greater investment per child.
- Family planning: Expanded access to contraception and reproductive healthcare gives women more control over the timing and number of births.
Death Rates and Life Expectancy
Global Life Expectancy in 2026
Global life expectancy at birth reached approximately 73.3 years as of the most recent UN data, an increase of more than 8 years since 1995. Life expectancy continues climbing in the post-pandemic period and is projected to reach roughly 77.4 years by mid-century.
Regional Differences in Life Expectancy
| Region | Life Expectancy (approx.) |
|---|---|
| Europe | 78–81 years |
| North America | 78–80 years |
| Latin America | 75–76 years |
| Asia | 74–76 years |
| Oceania | 73–75 years |
| Africa | 63–65 years |
These gaps reflect disparities in healthcare access, nutrition, sanitation, and the prevalence of infectious versus chronic disease across regions.
Age Structure of the World Population
Median Age of Humanity
The global median age in 2026 is approximately 31 years, though this varies enormously by region, from under 19 in much of sub-Saharan Africa to over 45 in countries like Japan and Italy.
Population by Age Group (Approximate Global Share)
| Age Group | Population Share |
|---|---|
| 0–14 | ~24% |
| 15–24 | ~16% |
| 25–64 | ~50% |
| 65+ | ~10% |
The Aging Population Challenge
The share of people aged 65 and older is rising steadily worldwide, placing growing pressure on pension systems, healthcare infrastructure, and labor markets, particularly in Europe, East Asia, and North America. By contrast, youth populations remain dominant across much of Africa, positioning the continent for a potential “demographic dividend” in the coming decades, if economic and educational systems can absorb the influx of young workers.
Population Growth by Region
- Africa: The fastest-growing region by far, driven by high fertility and a young population base. Africa’s population is projected to nearly double by 2050.
- Asia: Still growing overall, but the pace is slowing sharply, particularly in East Asia, where several countries are already shrinking.
- Europe: Already in population decline since around 2020, driven by sub-replacement fertility across nearly the entire continent.
- North America: Moderate growth, sustained primarily through immigration rather than natural increase.
- Latin America: Fertility has fallen rapidly in recent decades, and growth is slowing toward a plateau.
- Oceania: Continued modest expansion, supported by both natural increase and immigration, particularly in Australia.
Population Density Around the World
Population density varies dramatically depending on geography, climate, and historical settlement patterns. City-states and small, highly urbanized nations like Monaco, Singapore, and Bahrain post the highest densities globally, while vast, sparsely settled nations like Mongolia, Namibia, and Australia rank among the lowest. Dense populations bring both opportunities, economic agglomeration, infrastructure efficiency, and challenges, such as housing pressure, resource strain, and public health vulnerabilities.
Migration and Population Change
International migration continues to reshape national populations even where natural increase has stalled. Wealthy nations with low fertility rates, including much of Western Europe, the United States, and Gulf states, rely heavily on migration to sustain or grow their populations and labor forces. Conversely, several countries face significant population loss through emigration, often driven by economic hardship, conflict, or limited domestic opportunity.
World Population and Resources
A growing global population places direct and compounding pressure on:
- Food demand requires continued gains in agricultural productivity
- Water consumption is increasingly strained in arid and rapidly urbanizing regions
- Energy requirements, particularly as developing economies industrialize
- Housing needs, especially in fast-growing megacities
- Healthcare demand, intensified by both population growth and aging
- Education demand, particularly in youth-heavy regions like sub-Saharan Africa
Environmental Impact of Population Growth
Population growth interacts closely with environmental pressures, including climate change, land-use conversion for agriculture and urban expansion, biodiversity loss, and rising waste generation. However, demographers and environmental scientists increasingly emphasize that consumption patterns, not population size alone, drive much of the environmental impact, meaning that per-capita resource use in wealthy nations carries outsized weight relative to population numbers alone.
World Population Projections Beyond 2026
United Nations Population Forecasts
| Year | Estimated Population |
|---|---|
| 2030 | ~8.5–8.6 billion |
| 2040 | ~9.2 billion |
| 2050 | ~9.7–9.8 billion |
| 2060 | ~10.0–10.2 billion |
| 2100 | ~10.2–10.4 billion |
When Will Population Peak?
Current UN medium-variant projections suggest the global population will peak somewhere in the 2080s, at approximately 10.3–10.4 billion people, before beginning a slow, gradual decline. This represents a significant downward revision from earlier projections made just a decade ago, reflecting faster-than-expected fertility declines in several of the world’s most populous countries.
Will Population Ever Decline?
Yes, according to current projections. After peaking in the 2080s, the global population is expected to enter a slow decline through the remainder of the century, driven primarily by sustained low fertility in Asia, Europe, and the Americas, even as Africa continues contributing growth for longer.
Interesting World Population Facts
- Approximately 123,000 babies are born every day worldwide.
- Roughly 51,000 people die every day globally.
- Nigeria and India currently add the most people annually of any country.
- Africa is the fastest-growing continent by a wide margin.
- Nearly 4.8 billion people now live in urban areas.
- Asia is home to roughly 58% of all humanity.
- About 10% of the global population is now aged 65 or older.
- Roughly 24% of humanity is under the age of 15.
World Population Clock Explained
A population clock is a continuously updating estimate of global or national population, built on official statistical baselines combined with real-time interpolation of birth, death, and migration rates.
While remarkably accurate at large scale, population clocks are still estimates, not literal real-time counts, and should be understood as best-available approximations rather than precise figures.
Conclusion
The world population in 2026 stands at approximately 8.3 billion people, a figure that continues climbing but at a markedly slower pace than in past decades. Behind that single number lies a much more complex and regionally varied story: explosive growth across sub-Saharan Africa, structural decline already underway in parts of East Asia and Europe, and a global fertility rate that has fallen by more than half since the 1960s.
Humanity’s demographic center of gravity is shifting decisively toward Asia and Africa, even as aging populations reshape the economic and social priorities of wealthier nations. Looking ahead, the United Nations projects global population will continue rising through the 2080s, peaking somewhere near 10.3–10.4 billion people, before beginning a slow decline for the first time in recorded human history.
Understanding these trends, growth, aging, urbanization, and regional divergence is essential not just for demographers but for anyone trying to make sense of the economic, environmental, and geopolitical forces that will shape the rest of this century.
Frequently Asked Questions
What is the world population in 2026?
Approximately 8.3 billion people, based on UN and World Bank-aligned estimates.
Is the world population 8.3 billion in 2026?
Yes, most major demographic trackers converge on a figure close to 8.3 billion for mid-2026.
Which country has the largest population?
India, with approximately 1.46–1.47 billion people, has overtaken China in 2023.
What percentage of people live in Asia?
Roughly 58% of the world’s population lives in Asia.
How fast is the world population growing?
At a rate of approximately 0.83–0.84% per year as of 2026.
What will the world population be in 2030?
Approximately 8.5–8.6 billion, according to UN medium-variant projections.
When will the world population reach 9 billion?
Most projections place this milestone in the early-to-mid 2030s.
Which continent is growing fastest?
Africa, by a significant margin, is driven by high fertility and a young population structure.
Is population growth slowing down?
Yes. While the absolute population continues to rise, the annual growth rate has been declining steadily since its peak in the 1960s.
How accurate are population clocks?
Highly accurate at the global level, though individual country figures can carry larger margins of error due to data gaps and infrequent census updates.