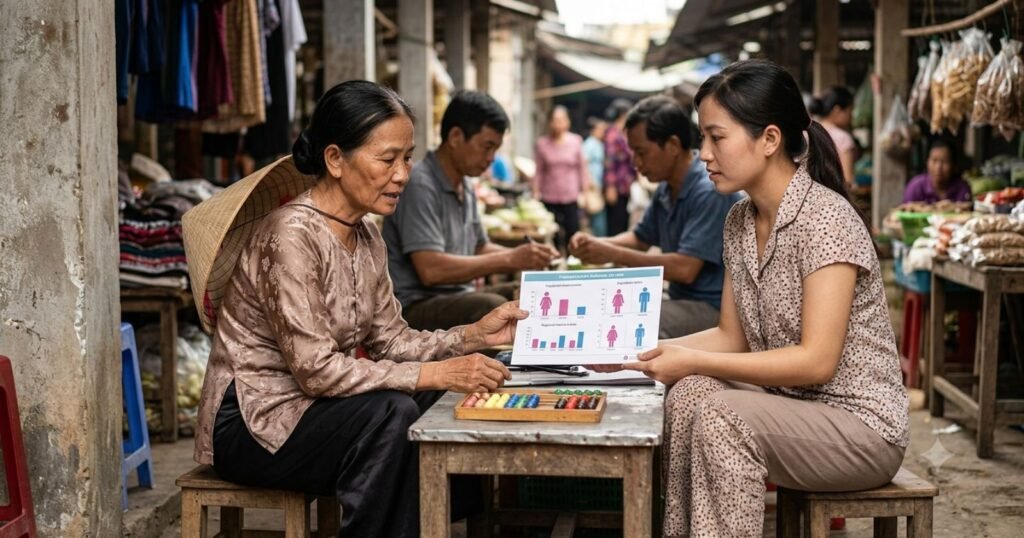
There are more men than women alive on Earth right now, by a margin of roughly 42 million people. That fact surprises most people, because it runs against a common assumption that women outnumber men globally. The truth is more interesting than either assumption: the world has had a male majority since the mid-1960s, yet flip the lens to people over 65 and the picture reverses completely, with women outnumbering men by tens of millions.
Zoom into individual countries and the range runs from Qatar, where men outnumber women by nearly two and a half to one, to Moldova, where women hold a clear majority. None of this is random. Every one of these patterns traces back to three demographic forces: how many boys versus girls are born, how mortality differs between the sexes at each age, and how migration reshuffles national populations.
What Is the World Sex Ratio?
The sex ratio is a single number that answers one question: for every 100 women in a population, how many men are there? A ratio of 100 means exact parity. A ratio above 100 means a male majority; below 100 means a female majority. Some sources instead report males per 1,000 females, or the reverse ratio of females per 100 males, so it is worth checking which convention a given figure uses before comparing sources.
Two ratios in particular get confused with each other:
- Sex ratio at birth measures boys born per 100 girls born in a given period. It reflects biology far more than social or economic conditions, and departs from the biological norm mainly where sex-selective practices occur.
- Total population sex ratio measures the balance across every living age group at once. It is shaped by sex ratio at birth, but even more by differential mortality and migration accumulated over decades, which is why a country can have a perfectly normal sex ratio at birth and still show a heavily skewed total population ratio.
How Many Men and Women Are There Worldwide?
According to United Nations Population Division data underpinning World Population Prospects 2024, and mid-decade estimates built on it, the global population in 2026 is approximately 8.30 billion, made up of approximately 4.172 billion males and 4.129 billion females. That works out to a global sex ratio of roughly 101 males per 100 females, meaning men make up about 50.3% of humanity and women about 49.7%.
Global Population by Sex
| Year | Male Population | Female Population | Global Sex Ratio (males per 100 females) |
|---|---|---|---|
| 2000 | ~3.09 billion | ~3.01 billion | ~102.7 |
| 2024 | ~4.09 billion | ~4.05 billion | ~101.0 |
| 2026 | ~4.172 billion | ~4.129 billion | ~101.0 |
Source: World Bank Gender Data Portal, StatisticsTimes World Sex Ratio 2026, built on UN World Population Prospects 2024 Revision.
2024 marked a notable milestone: it was the first year both the male and female populations simultaneously exceeded 4 billion. The male population has grown from about 1.25 billion in 1950, more than tripling over roughly 75 years, adding on the order of 40 to 45 million men annually through the 2000s and 2010s. The female population has grown at a nearly identical pace over the same period, which is why the overall ratio has stayed close to constant even as absolute numbers have climbed dramatically.
Does the World Have More Men or Women?
Globally, more men. The world has had a male-majority population since roughly the mid-1960s. Pew Research Center’s analysis of UN data found the surplus has been persistent rather than a temporary blip, though the UN projects the global ratio will move toward parity by around 2050 as population aging, which favors longer-lived women, plays an increasingly large role in the overall total.
The apparent contradiction with everyday intuition, that many people assume women are the global majority, resolves once you split the population by age. Below is why.
Sex Ratio at Birth
Absent intervention, human biology produces a remarkably stable pattern: about 105 boys are born for every 100 girls. That figure of 105.3, drawn from UN World Population Prospects 2024 data via Our World in Data, holds with only modest variation across most populations and most of recorded history, and is generally understood as a stable biological baseline rather than a socially determined outcome.
Departures from that baseline in specific countries or periods, most notably in parts of East and South Asia during the 1980s through 2000s, have been linked in demographic literature to sex-selective practices tied to strong son preference, though the scale and persistence of these deviations vary substantially by country and have narrowed in several cases in more recent data. The natural male surplus at birth is itself the starting point for the age-based pattern described below: boys start life outnumbering girls, but that surplus erodes and eventually reverses as the cohort ages.
Why Sex Ratios Change With Age
The single biggest driver of the sex ratio’s transformation across the lifespan is differential mortality. Men experience higher mortality rates than women at nearly every adult age, a pattern consistent across nearly all countries and rooted in a combination of biological factors and higher rates of accidental death, violence and certain chronic diseases among men. Women’s longer average life expectancy compounds year after year, so the roughly 105-to-100 male surplus at birth steadily narrows through childhood and working age, reaches parity somewhere in mid-adulthood, and then inverts sharply at older ages.
Sex Ratio by Age Group, World, 2026
| Age Group | Sex Ratio (males per 100 females) |
|---|---|
| At birth | 105.3 |
| 0-14 | 105.8 |
| 15-64 | 103.2 |
| 65+ | 80.1 |
Source: StatisticsTimes World Sex Ratio 2026, based on UN World Population Prospects 2024.
By age 65 and older, the ratio has swung from a roughly 5% male surplus at birth to a roughly 20% female surplus, meaning for every 100 women over 65 worldwide there are only about 80 men. That reversal is the reason the “more women than men” assumption feels intuitively true to many people: most personal experience of extreme old age, whether observing grandparents, retirement communities or centenarians, skews heavily female, even though the population as a whole skews slightly male.
Countries With More Men
Migration, not birth patterns, produces the largest sex ratio imbalances found anywhere in the world, concentrated overwhelmingly in Gulf states with large temporary male labor forces.
Countries With the Highest Sex Ratios
| Rank | Country | Males per 100 Females |
|---|---|---|
| 1 | Qatar | ~244-248 |
| 2 | United Arab Emirates | ~175-177 |
| 3 | Oman | ~164-167 |
| 4 | Bahrain | ~163 |
| 5 | Kuwait | ~139 |
| 6 | Maldives | above 150 |
| 7 | Saudi Arabia | above 150 |
Source: StatisticsTimes Countries by Sex Ratio 2026; populationpyramids.org, drawing on UN World Population Prospects 2024.
Qatar’s ratio, the most extreme of any country on Earth, is a direct product of its labor-migration economy: migrant workers, disproportionately male and drawn largely from South Asia, Egypt and the Philippines, make up roughly 88% of the country’s population, according to World Population Review’s analysis. The UAE’s second-place ratio follows the identical logic, with expatriate male workers in construction and energy vastly outnumbering the Emirati population.
Notably, these ratios have been easing in recent years: the UAE fell from about 228 males per 100 females in 2021 to roughly 176 by 2024, and Qatar slipped from around 266 to about 246 over the same period, a pattern consistent with a maturing labor market that is somewhat less construction-heavy than during the peak infrastructure boom years of the 2010s and early 2020s.
Beyond the Gulf, three of the world’s most populous countries, China, India and the United States, all report modest male majorities. India’s ratio of roughly 106 males per 100 females, while far less extreme than any Gulf state, translates into an absolute male surplus of more than 40 million people simply because of the country’s enormous population base, a reminder that a small percentage skew can represent an enormous number of people in a large country.
Countries With More Women
At the opposite extreme, women significantly outnumber men, and the pattern clusters overwhelmingly in one region: post-Soviet Eastern Europe and the Caucasus, plus a scattering of aging island territories.
Countries With the Lowest Sex Ratios (Highest Female Share)
| Rank | Country/Territory | Males per 100 Females |
|---|---|---|
| 1 | Moldova | ~85.2 |
| 2 | Hong Kong | ~81.7-81.8 |
| 3 | Guadeloupe | ~82.4 |
| 4 | Martinique | ~82.9 |
| 5 | Latvia | ~86.4-86.6 |
| 6 | Russia | ~86.5-86.6 |
| 7 | Armenia | ~86.6 |
| 8 | Ukraine | ~87.0 |
| 9 | Belarus | ~87.2 |
Source: datapandas.org and populationpyramids.org, citing UN World Population Prospects 2024.
Former Soviet states account for a striking majority of the countries with the lowest sex ratios on Earth, six to seven of the bottom eight or nine positions depending on the exact dataset and year. The underlying cause is not migration but mortality: Eastern Europe has long recorded much higher mortality rates among adult men than women, a pattern researchers at Our World in Data attribute in part to the region’s historically elevated rates of alcohol-related and cardiovascular deaths among men, compounding the effects of World War II-era military losses whose demographic echo persisted for decades afterward.
Hong Kong presents a different mechanism: its low ratio, with women making up nearly 55% of the population, reflects both longer female life expectancy and the presence of a substantial female migrant domestic worker population, illustrating that migration can push a national ratio in either direction depending on the composition of the workforce it brings in.
Sex Ratio by Region
Regional averages smooth over the extremes above but still reveal meaningful contrasts. Asia and North America report modest overall male majorities, driven by both a large weight of population in the working-age brackets and, in Asia’s case, the historical influence of sex ratio at birth imbalances in a handful of very large countries.
Europe, in aggregate, tilts female, a legacy of the same Eastern European mortality patterns visible at the country level, combined with the region’s advanced population aging, which mechanically shifts weight toward the older, more female-skewed age brackets. Africa’s overall ratio sits close to global parity, reflecting its comparatively young age structure, in which the older, more heavily female cohorts still represent a small share of the total population.
How Migration Changes the Sex Ratio
Migration is, after mortality, the second major force reshaping national sex ratios, and unlike mortality it can move a country’s ratio significantly within a single decade rather than over generations. Labor migration corridors tend to be strongly sex-selective: construction, energy and some manufacturing sectors recruit disproportionately male workforces, which is the direct mechanism behind the extreme ratios recorded in Qatar, the UAE, Oman, Bahrain and Kuwait. Conversely, sectors such as domestic work and some caregiving occupations recruit disproportionately female workforces, contributing to the female-skewed ratios seen in destinations like Hong Kong.
Because migrant populations in Gulf states are overwhelmingly working-age and largely arrive without accompanying family members, their effect on the host country’s sex ratio is magnified relative to a migration flow of similar size made up of family units. This is also why Gulf sex ratios have proven relatively responsive to shifts in the underlying labor market, easing measurably between 2021 and 2024 as construction-driven demand moderated.
How the Global Sex Ratio Has Changed
The global sex ratio has held remarkably close to its current level of around 101 for decades, moving only gradually as the underlying age structure of the world’s population shifts. The UN’s central projection is that the global population will move toward sex parity by around 2050, driven primarily by continued population aging: as the share of the global population in the 65-plus bracket grows, and that bracket is disproportionately female, its weight increasingly offsets the modest male surplus present at birth and through working age.
This is a projection based on demographic momentum already built into the age structure of the current population, not a forecast contingent on any single policy change, though the UN frames all such long-range projections as one plausible outcome among a defined range rather than a certainty.
What the Sex Ratio Means for Population Structure
A national sex ratio far from 100 carries real, if often localized, consequences. In countries with an extreme male surplus concentrated in the working-age population, such as the Gulf states, the imbalance shapes household formation, consumption patterns weighted toward single male workers rather than families, and demand for services oriented around a temporary rather than settled population. In countries with a pronounced older-age female surplus, such as much of Eastern Europe, the imbalance concentrates pressure on eldercare systems, pension structures and healthcare services disproportionately used by older women living alone.
It is worth treating claims about marriage markets and broader social consequences of sex ratio imbalance with some caution: while researchers have documented associations between sharply skewed sex ratios and certain social outcomes in specific national contexts, the size and direction of these effects vary considerably by country, and the topic remains an area of active and sometimes contested research rather than one with a single settled global finding.
Key Findings
- The world has a slight male majority, about 101 men per 100 women, or roughly 4.172 billion men versus 4.129 billion women in 2026, a surplus of about 42 million.
- The global male majority has held since the mid-1960s but is projected by the UN to move toward parity by around 2050 as population aging increasingly favors the longer-lived female population.
- The natural sex ratio at birth of about 105 boys per 100 girls steadily narrows with age and inverts by 65 and older, where the global ratio falls to about 80 males per 100 females.
- Qatar has the world’s most male-skewed population, around 244 to 248 men per 100 women, driven almost entirely by a migrant labor force that makes up roughly 88% of its residents.
- Moldova, Hong Kong and a cluster of former Soviet states, including Russia, Latvia, Ukraine, Armenia and Belarus, have the world’s most female-skewed populations, a pattern rooted mainly in historically elevated male mortality rather than migration.
- India’s modest male-majority ratio of about 106 per 100 nonetheless translates into an absolute surplus of more than 40 million men, the largest such surplus of any country, simply due to population scale.
Frequently Asked Questions
1. Are there more men or women in the world?
There are more men. The global sex ratio is approximately 101 males per 100 females as of the mid-2020s, meaning roughly 42 million more men than women live on Earth.
2. Which country has the most men relative to women?
Qatar has the highest sex ratio in the world, at roughly 244 to 248 males per 100 females, a result of its very large, predominantly male migrant labor force.
3. Which country has the most women relative to men?
Moldova currently has the lowest sex ratio recorded globally, around 85 males per 100 females, though Hong Kong and several former Soviet states, including Russia, Latvia and Ukraine, sit close behind.
4. Why are there more women among older people?
Men experience higher mortality than women at nearly every adult age, so the modest male surplus present at birth steadily erodes through the lifespan and reverses by around age 65, when the global ratio falls to roughly 80 men per 100 women.
5. What is the normal sex ratio at birth?
Absent intervention, about 105 boys are born for every 100 girls worldwide, a ratio considered the stable biological baseline across most human populations.
6. Why does the global sex ratio feel wrong to most people’s intuition?
Because the two most visible parts of the population, working-age adults and the very elderly, pull in opposite directions: men modestly outnumber women overall and at working age, but women clearly outnumber men at advanced ages, which is the group most visibly associated with “more women than men” in everyday experience.
7. Is the sex ratio at birth the same as the total population sex ratio?
No. Sex ratio at birth measures only newborns in a given period and reflects mainly biology. Total population sex ratio measures every living age group at once and is shaped far more by cumulative mortality differences and migration over decades.
8. Do China and India still have unusually skewed sex ratios?
Both report modest overall male majorities, around 106 males per 100 females in India’s case, well below the extremes found in Gulf states, though both countries have drawn demographic research attention historically for elevated sex ratios at birth in specific decades and regions.
9. How does migration affect a country’s sex ratio?
Migration is the largest driver of the most extreme national sex ratios in the world. Labor migration into construction, energy and similar sectors is heavily male, producing the skewed ratios seen in Qatar, the UAE and other Gulf states; migration into domestic work and caregiving sectors tends to skew ratios female instead.
10. Will the global sex ratio reach parity?
The UN’s central population projection anticipates the global sex ratio moving close to parity by around 2050, driven mainly by continued population aging rather than any expected change in birth patterns.
Sources
- United Nations Department of Economic and Social Affairs, Population Division, World Population Prospects 2024 Revision
- Pew Research Center, “Global population skews male, but UN projects parity between sexes by 2050,” April 2025
- Our World in Data, “Sex ratio at birth,” adapted from UN World Population Prospects 2024
- StatisticsTimes.com, “World sex ratio 2026” and “Countries by sex ratio 2026”
- World Bank Gender Data Portal, SP.POP.TOTL.MA.IN and SP.POP.TOTL.FE.IN, 2025
- populationpyramids.org, “Male to Female Ratio by Country 2026”
- datapandas.org, “Countries By Sex Ratio,” citing UN World Population Prospects 2024
- World Population Review, “Countries by Sex Ratio 2026”