
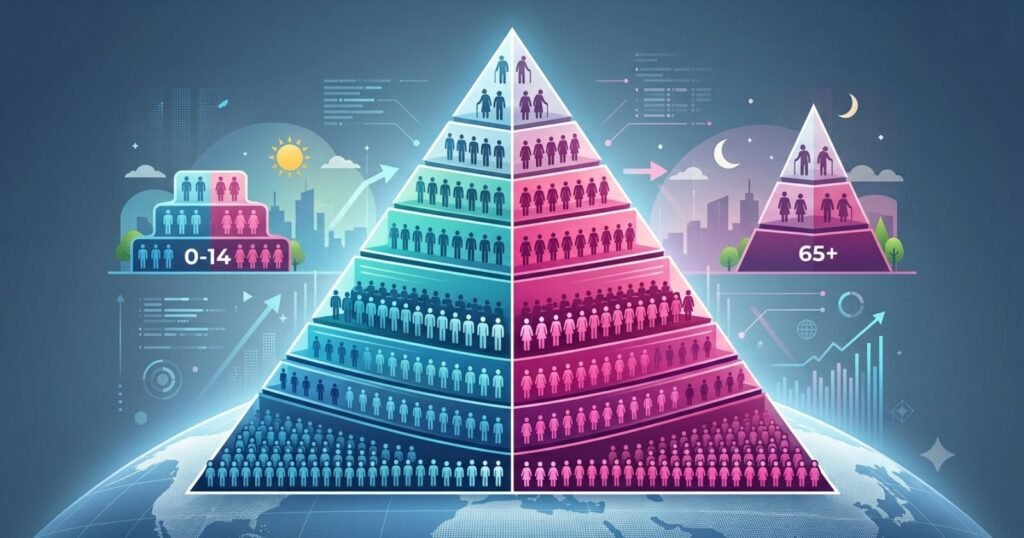
Eight billion is a headline number. It says nothing about whether that population is stocked with toddlers or retirees, whether classrooms are overflowing or pension systems are strained. Two countries can share an identical total population and still face completely different futures, because the number that predicts schools, workforces, and hospital demand is not total population. It is age structure: how that total splits between children, working-age adults, and older people.
A country of 50 million people where a third are under 15 faces a very different set of policy questions, school construction, job creation for a wave of future entrants, than a country of 50 million where a third are 65 or older, which instead faces pension funding, elder care capacity, and a shrinking pool of future workers. Total population size answers how big a country or the world is. Age structure answers what kind of demographic pressure that size is actually generating, and that pressure changes constantly as each generation ages into the next bracket.
This piece breaks the global population down by age group as of the most recent United Nations estimates, traces how that breakdown has shifted since 1950, and lays out where it is headed through 2100.
How the World Population Is Divided by Age
Demographers typically use a small set of standard age bands to describe a population:
- Under 5: infants and toddlers, a group closely tied to current fertility and birth trends.
- Under 15: the broader child population, used in most youth-dependency calculations.
- Ages 15 to 24: youth entering education, training, and early employment.
- Working age (15 to 64): the group most directly tied to labor force size and economic output.
- Ages 65 and above: the older population, the standard threshold for aging-society statistics.
- Ages 80 and above: the oldest old, a fast-growing group tied closely to long-term care demand.
Global Population by Age Group Today
Based on the UN World Population Prospects 2024 Revision, the roughly 8.2 billion people alive today split as follows:
| Age Group | Approximate Share of Global Population | Approximate Number of People |
|---|---|---|
| Under 15 | ~24.5% | ~2.0 billion |
| 15 to 64 (working age) | ~65% | ~5.3 billion |
| 65 and above | ~10.3% | ~0.85 billion |
| 80 and above | ~1.7% | ~0.14 billion |
The global median age, the point at which half the population is younger and half older, stands at approximately 31 years. Men and women are split close to evenly at younger ages, but the ratio shifts steadily toward women in the oldest age brackets, since women generally live longer than men in almost every country.
The working-age band, spanning ages 15 to 64, is by far the largest single group, holding close to two out of every three people alive. That group is the closest available proxy for the global labor force, though actual employment depends on labor force participation rates, education, and available jobs, not just raw headcount. The under-15 population, at roughly 2 billion, still outnumbers the entire population of any single country on earth, and the 65-plus population, at roughly 850 million, is now larger than the combined population of the European Union and the United States.
How the Global Age Structure Has Changed
In 1950, the world’s age structure looked fundamentally different from today’s. More than a third of the global population was under age 15, reflecting the high fertility and high child mortality that had defined most of human history up to that point. The share aged 65 and above sat at only around 5 percent.
| Indicator | 1950 | Today (2024/2025) | Change |
|---|---|---|---|
| Share under 15 | ~34% | ~24.5% | Down roughly 10 percentage points |
| Share 15 to 64 | ~61% | ~65% | Up roughly 4 percentage points |
| Share 65 and above | ~5% | ~10.3% | More than doubled |
| Global median age | ~24 years | ~31 years | Up roughly 7 years |
Key finding: The share of children in the global population has been falling for decades, while the share of working-age adults has been rising, and the share of older people has more than doubled. This is the demographic transition working its way through the entire planet at once, just at very different speeds in different regions.
Why the World Is Getting Older
Four forces sit behind this shift, and they reinforce each other rather than acting alone. None of them acts in isolation, and the combined effect compounds over successive generations rather than showing up as a single sharp break in the data.
- Declining fertility: the global total fertility rate has fallen from roughly five children per woman in the 1960s to 2.25 in 2024, shrinking the base of the population pyramid with each successive generation.
- Falling mortality: fewer people die at every age, which by itself pushes more of the population into older brackets over time, independent of any change in birth rates.
- Longer life expectancy: global life expectancy at birth reached 73.3 years in 2024, up 8.4 years since 1995, and is projected to reach around 77.4 years by 2054, extending the average number of years spent in the older age brackets.
- Improvements in child survival: far fewer children now die before age five than in past decades, meaning each birth is more likely to eventually become an adult, and later, an older adult, which raises the surviving population at every subsequent age.
Young Populations Versus Older Populations
Age structure varies enormously by region, and the gap between the youngest and oldest regions is widening rather than narrowing.
| Region | Approx. Share Under 15 | Approx. Share 65 and Above | Character |
|---|---|---|---|
| Sub-Saharan Africa | ~41% | ~3% | Youngest region on earth |
| South Asia / Middle East and North Africa | ~28-30% | ~5-6% | Youthful, transitioning |
| Latin America and the Caribbean | ~22% | ~9% | Mid-transition |
| North America | ~17% | ~17-18% | Aging, close to balanced |
| Europe and Central Asia | ~17% | ~18-20% | Oldest region on earth |
| East Asia | Falling rapidly | Rising rapidly | Among the fastest-aging populations globally |
Sub-Saharan Africa’s age structure sits at almost the exact opposite end of the spectrum from Europe’s. In Sub-Saharan Africa, children under 15 outnumber people 65 and older by roughly 13 to 1. In parts of Europe, the ratio has already flipped, with older people outnumbering children. That divide is not static.
Fertility is falling across nearly every region, including Sub-Saharan Africa, but from such different starting points and at such different speeds that the gap between the world’s youngest and oldest regions is projected to persist, and in some measures widen, for decades to come.
East Asia illustrates how quickly a region can move along this spectrum: countries such as South Korea, China, and Japan have gone from relatively young age structures in the mid-20th century to some of the fastest-aging populations on record within a single lifetime, a pace of transition that took Europe far longer to complete.
How Age Structure Affects Society
The practical consequences of a population’s age structure reach into nearly every part of public and economic life, often years before the underlying demographic shift becomes obvious in everyday experience.
- Schools: a large under-15 population drives demand for classrooms, teachers, and education budgets, particularly across Sub-Saharan Africa and parts of South Asia, where school-age cohorts are still expanding in absolute numbers.
- Employment: a large working-age share can fuel economic growth if matched with sufficient jobs, a dynamic economists call the demographic dividend, though the dividend only materializes when education and job creation keep pace with the expanding labor pool.
- Healthcare: aging populations shift medical demand toward chronic disease management, while young populations concentrate demand around maternal and child health, requiring very different healthcare infrastructure and staffing.
- Housing: growing working-age cohorts raise demand for new housing stock and urban infrastructure, while aging populations shift demand toward accessible housing and assisted living.
- Pensions: a shrinking working-age base relative to retirees strains pay-as-you-go pension systems, a challenge already acute in Japan, Italy, and South Korea.
- Government spending: budget priorities shift measurably between education-heavy and healthcare-heavy allocations as a population ages, forcing difficult long-term fiscal tradeoffs.
- Consumer markets: industries from baby products to retirement housing track age structure closely when forecasting demand, since a shifting age balance can reshape entire sectors over a generation.
Future Global Age Structure
The UN’s projections point toward a population that keeps growing in absolute terms for several more decades while its internal balance shifts decisively toward older ages.
| Milestone | Approximate Timing | What Changes |
|---|---|---|
| Children and 65+ population converge | By the 2050s in many regions, later globally | The 65+ group is on track to overtake the under-18 population globally by the late 2070s |
| 80+ population exceeds infant population | Mid-2030s | Roughly 265 million people aged 80+ versus a shrinking number of infants |
| Global median age reaches ~37 years | By 2050 | Up from approximately 31 years today |
| Working-age share peaks then declines in most regions | Varies by region, already underway in East Asia and Europe | Shrinking labor pools in the world’s largest economies |
“The main driver of global population increase through mid-century will be the momentum created by growth in the past,” the United Nations noted in its World Population Prospects 2024 summary, pointing to the still-expanding number of women of reproductive age as the reason growth continues even as birth rates per woman fall.
By 2100, UN projections describe a global population structure that looks fundamentally different from any point in recorded history: a narrower base of children, a large and roughly stable working-age band, and a substantially expanded older population, a shape demographers describe as moving from a classic pyramid toward something closer to a column.
Conclusion
The headline population number, 8.2 billion today and climbing toward a projected peak above 10 billion, tells only part of the story. The share of that total made up of children has been shrinking for 70 years. The share made up of working-age adults has been rising. The share made up of people 65 and older has more than doubled since 1950 and is on track to keep climbing well into the next century. Total population growth is slowing, but population aging is accelerating, and the two trends are set to define global demographics for the rest of this century regardless of exactly when the world’s headcount stops growing.
For most of the 20th century, the defining demographic question was how fast the world’s population was growing. For the rest of the 21st century, the more useful question is likely to be how old that population is, and how unevenly that aging is distributed between a still-young Africa and a rapidly graying Europe, East Asia, and eventually the Americas. Age structure, not total headcount, is the number worth watching next.
Frequently Asked Questions
1. What percentage of the world’s population is under 15?
Approximately 24.5 percent, or roughly 2 billion people, as of the most recent UN estimates.
2. What percentage of the world’s population is 65 or older?
Approximately 10.3 percent, or roughly 850 million people.
3. What is the global median age?
Approximately 31 years today, up from about 24 years in 1950, and projected to reach roughly 37 years by 2050.
4. Which region has the youngest population?
Sub-Saharan Africa, where roughly 41 percent of the population is under 15 and only about 3 percent is 65 or older.
5. Which region has the oldest population?
Europe, where the share aged 65 and above already exceeds the share under 15 in many countries.
6. Is the share of children in the world population rising or falling?
Falling. It has dropped from roughly 34 percent in 1950 to about 24.5 percent today, and is projected to keep declining.
7. When will people aged 65 and older outnumber children globally?
The UN projects the 65-plus population will surpass the under-18 population globally by the late 2070s.
8. Why is the working-age share of the population important?
Because it is the group most directly tied to labor force size and, when large relative to dependents, can drive faster economic growth through the demographic dividend.
9. How fast is the 80-plus population growing?
Fast enough that by the mid-2030s, the UN projects roughly 265 million people aged 80 or older worldwide, more than the number of infants.
10. What causes a population’s age structure to shift over time?
Primarily declining fertility and falling mortality working together, along with rising life expectancy and improved child survival, which together push a larger share of the population into older age brackets.
Sources
- United Nations, World Population Prospects 2024 Revision, Population Division, Department of Economic and Social Affairs
- United Nations, World Population Prospects 2024: Summary of Results
- Our World in Data, “Age Structure,” based on UN World Population Prospects 2024
- World Bank, “Population Ages 0-14,” “Population Ages 15-64,” and related indicators
- Statista, “World Population by Age and Region 2024,” based on World Bank data
- Wikipedia, “World Population” and “List of Countries by Age Structure”





