When the first millennials were born in 1981, the average woman in the world had close to four children and the world held about 4.5 billion people. By 2024 the global fertility rate had fallen to 2.25, life expectancy had reached 73.3 years, and the population stood at 8.2 billion. The generation born between 1981 and 1996 lived through the sharpest part of that turn, which is why demographers and journalists sometimes call millennials a bridge generation.
The label needs careful handling. Millennials did not cause the shift, and most of the underlying changes began before 1981 and continue after 1996. What the cohort offers is a clear vantage point: its members were children in a younger, faster-growing, offline world and are now adults in an older, slower-growing, connected one.
Data Snapshot
| Indicator | 1950 | 1990 | 2024 | Source |
|---|---|---|---|---|
| World population | 2.5 billion | 5.3 billion | 8.2 billion | UN WPP 2024 |
| Total fertility rate (births per woman) | About 4.9 | 3.31 | 2.25 | UN WPP 2024 |
| Life expectancy at birth (years) | About 46 | 64.0 | 73.3 | UN WPP 2024 |
| Share of population aged 65+ | About 5% | About 6% | About 10% | UN WPP (rounded) |
Defining the Two Population Eras
The first era, running roughly from 1950 to the 1990s, combined falling mortality with still-high fertility. Child survival improved fast while women kept having four or five children, so the population surged. World growth peaked at about 2.1% a year in the late 1960s. Median age worldwide stayed near 24 in 1990, and most people alive were children or young adults.
The second era, now under way, pairs continued gains in longevity with fertility at or below replacement in most of the world. According to the UN, two-thirds of the global population lives in countries or areas where fertility is below 2.1 children per woman. Growth has slowed to under 1% a year. Population peak is projected near 10.3 billion in the mid-2080s, and by 2080 people aged 65 or older will outnumber children under 18.
| Feature | Earlier era (to about 1990) | Current era (from about 2000) |
|---|---|---|
| Fertility | Near 5 in 1950; 3.31 in 1990 | 2.25 in 2024 |
| Mortality | Rapid fall in child deaths | Gains concentrated in older ages |
| Population growth | Accelerating, then peaking | Slowing, under 1% a year |
| Age structure | Young, expanding base | Ageing, with 65+ the fastest-growing group |
| Urbanization | Mostly rural | More than half urban since 2007 |
| Communication | Broadcast and landline | Internet and mobile |
National timelines differ widely. Japan completed its transition by the 1970s, Nigeria is mid-transition, and India has reached replacement-level fertility only in recent years. The two eras are therefore a global average, and a person’s country determines which one dominated childhood.
Who Are Millennials in the Generational Timeline?
Pew Research Center places millennials between 1981 and 1996, after Generation X (1965 to 1980) and before Generation Z (1997 to 2012). In 2026 they are 30 to 45 years old. An editorial aggregation of UN age data suggests roughly 1.8 to 1.9 billion millennials worldwide, about 22% of the population. Generation labels vary by source, and the cohort definition used here is a convention, not an official statistical category.
Growing Up During a Demographic and Technological Transition
Childhood in a Pre-Smartphone World
Millennials spent childhood before ubiquitous mobile internet. ITU estimates put the share of the world’s people using the internet at around 16% in 2005, when the oldest millennials were 24. By 2024 the figure was about 68%, or roughly 5.5 billion people. The oldest members of Generation Z were around 10 when the first iPhone appeared in 2007. Access depended heavily on country income: in much of sub-Saharan Africa, mobile internet reached the typical teenager only in the 2010s.
Entering Adulthood in a Digitally Connected Economy
Millennials entered labor markets as social media, e-commerce and platform work spread, and as the share of people living in cities passed 50% in 2007 according to UN estimates. The UN projects that urban residents will make up about 68% of world population by 2050. Many millennials therefore changed jobs, skills and cities more often than their parents.
Experiencing Major Economic and Social Changes
The 2008 financial crisis struck when millennials were between 12 and 27. US unemployment reached 10.0% in October 2009, and euro area youth unemployment exceeded 55% in Spain and Greece in 2013. The 2020 pandemic then hit when the oldest millennials were 39. Marriage and first births moved later across most high-income countries, with the US median age at first marriage reaching 30.2 for men and 28.6 for women in 2024.
Millennials Between Different Population Structures
The age structure around millennials changed sharply during their lives. Worldwide, those 65 and older rose from about 6% of the population in 1990 to about 10% in 2024, with the UN projecting about 16% by 2050. The global old-age dependency ratio, the number of people 65 and older per 100 adults aged 15 to 64, is roughly 16 today.
Life expectancy has risen 9.3 years since 1990, from 64.0 to 73.3, so millennials are far more likely than their grandparents to share decades of life with parents and grandparents. Population momentum has also kept the world’s absolute numbers growing: the UN notes that growth continues even below replacement fertility because of the large number of women of reproductive age.
| Country | Median age (approx.) | Fertility rate | Share aged 65+ (approx.) |
|---|---|---|---|
| Japan | 50 | 1.15 (2024) | 29% |
| Germany | 45 | 1.35 (2024) | 22% |
| United States | 39 | About 1.6 (2024) | 18% |
| China | 40 | About 1.0 | 15.6% (2024) |
| India | 29 | About 2.0 | 7% |
| Nigeria | 18 | About 4.4 | 3% |
Figures are rounded; they combine UN World Population Prospects 2024 and national agencies.
The Millennial Connection Between Older and Younger Generations
Millennials and Generation X
Generation X grew up in a world with fewer children per household than the boomers but entered adulthood before the internet economy. Gen X members remember analog careers and digital adoption at working age. Millennials had a smaller share of life without the internet and a larger share of working life during it, and they came of age during the 2008 crisis rather than the late-twentieth-century expansion. Cohort sizes differ by country: in the United States Gen X numbered about 65 million in 2019 against 72.1 million millennials.
Millennials and Generation Z
Generation Z has never known a world without broadband and, in high-income countries, spent most of its childhood with smartphones. Its adult transition is also starting at a time of lower fertility: the global rate has fallen from 3.31 in 1990 to 2.25. Gen Z’s household patterns are largely unobserved because its oldest members are 29, so claims about its break from millennials remain provisional.
Millennials and Baby Boomers
The boomer generation, born 1946 to 1964, is now 62 to 80 and reaching older age in large numbers. In the United States, boomers peaked at 78.8 million in 1999 and are being replaced by younger cohorts supported by immigration. Millennials sit across the intergenerational transfer: many are raising children while providing support to parents. Millennial workers are also paying into pension systems that serve a growing group of older adults.
The Millennial Generation Across Different Countries
The bridge idea works best in societies that finished the transition within the millennials’ lifetimes. In South Korea, fertility fell from about 4.5 in 1970 to roughly 2.1 in 1983 and 0.75 in 2024, so a Korean millennial grew up in a country where classroom sizes and family sizes shrank dramatically. In Japan, births fell from 1.53 million in 1981 to 1.21 million in 1996 and to 686,061 in 2024, with Japanese millennials a mid-sized cohort between larger boomer-era groups and a much smaller generation after them.
In India, fertility fell from roughly 4.5 to about 2 during the same period, so Indian millennials passed through the transition in a country still adding population. In Nigeria, fertility remains about 4.4, and millennials are an early-adult group inside a youth-dominated society. For them, the “second era” is mostly about technology, not ageing. The bridge concept therefore describes a high-income and upper-middle-income experience far better than a universal one.
The Economic and Social Role of Millennials
Millennials are in prime working and parenting years. They make up much of the workforce in high-income countries, drive first-time household formation and increasingly shoulder care for older relatives. Cohort size is not the same as influence: in Germany or Japan millennials are numerically smaller than adjacent generations yet central to labor supply, while in India they are one of several large groups. Intergenerational transfers also flow both ways, from parents to adult children for housing and from adult children to older parents for care.
Are Millennials Really a Bridge Generation?
Some transitions fit the label. Millennials experienced the fall of fertility toward replacement, the spread of the internet from scarce to common, and the arrival of an older population structure. Other changes began before 1981. The fertility decline in East Asia started in the 1960s, and mortality improvements date from the mid-twentieth century.
Several shifts continue strongly among Generation Z, including smartphone use and delayed childbearing, so millennials are not a boundary in any strict demographic sense. A fair summary is that millennials are the first large cohort to live through both eras as adults, and no more than that.
The Legacy of Millennials in the Next Population Era
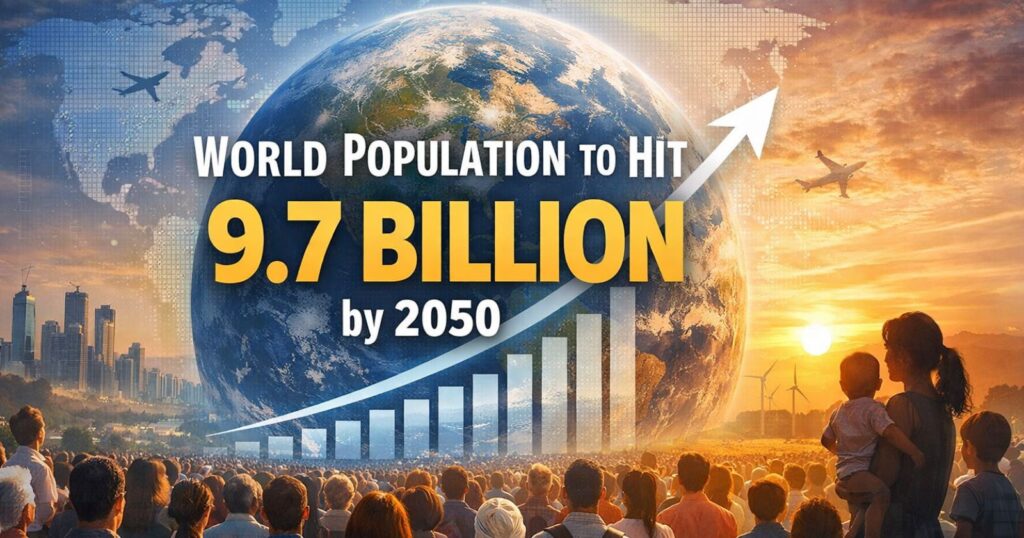
By 2050 millennials will be 54 to 69 years old. UN projections put global population at 9.7 billion that year, with the 65-and-older share near 16%. The millennial cohort will therefore move from the center of the workforce to the early retirement ages just as the old-age dependency ratio climbs. Its members may be the first generation to carry both the cost of children and the cost of long-lived parents in many countries, and later the first to rely on pension systems built for younger age structures.
Conclusion
The strongest evidence for the bridge label is the pair of global shifts that coincided with millennial lives: fertility down from 3.31 to 2.25 since 1990 and life expectancy up 9.3 years. The label weakens when national differences are added, because Nigeria and Japan describe two different millennial experiences. A more accurate description is that millennials are the first cohort to be adults in both eras, and that the generation’s most distinctive demographic role comes after 2040, as its members move into the ages when old-age dependency rises.
Key Findings
- World fertility fell from 3.31 in 1990 to 2.25 in 2024 while life expectancy rose from 64.0 to 73.3 years.
- Two-thirds of the world’s people live in countries with below-replacement fertility, according to UN estimates.
- Global internet use rose from roughly 16% of people in 2005 to about 68% in 2024 (ITU).
- Japan’s annual births dropped from 1.53 million in 1981 to 686,061 in 2024.
- The bridge idea describes upper-income and ageing societies better than Nigeria or other young-population countries.
Frequently Asked Questions
1. Why are millennials called a bridge generation?
Millennials were children before smartphones and young adults during the internet’s expansion, and they lived through the fall of fertility toward replacement. The label is editorial, not an official demographic term.
2. Which generations surround millennials?
Using Pew boundaries, Generation X (1965 to 1980) comes before and Generation Z (1997 to 2012) after. Other bodies shift boundaries by a few years.
3. What demographic changes did millennials experience?
World fertility fell from near 4 at birth to 2.25, life expectancy rose by more than nine years since 1990, the 65-and-older share rose from about 6% to about 10%, and the world became majority urban in 2007.
4. Are millennials a global bridge generation?
Not uniformly. Japan, Korea and Germany saw the full transition within their lifetimes, while Nigeria remains a high-fertility, young-age-structure society.
5. How are millennials different from Generation Z?
Gen Z grew up with smartphones and slower population growth. Millennials grew up before mobile internet and experienced the 2008 crisis as youths. Age-matched adult comparisons remain limited because Gen Z is 14 to 29.
6. What demographic era will follow millennials?
The UN medium projection shows world population peaking near 10.3 billion in the mid-2080s and 65-and-older people outnumbering under-18s by 2080. No official name exists for this era.
7. How many millennials are alive?
An editorial aggregation of UN data suggests about 1.8 to 1.9 billion, or roughly 22% of the world’s people. No official agency counts by generation.
8. How old are millennials in 2026?
Between 30 and 45 under the Pew range.
9. Did millennials cause the decline in birth rates?
No. Fertility decline began in many countries decades before 1981. Millennials are the first generation to have their childbearing years largely in the low-fertility era.
10. Is the old-age dependency ratio rising for millennials?
Yes. It is about 16 per 100 adults aged 15 to 64 worldwide and far higher in Japan, Italy and Germany, where it rises further as millennials approach older ages.
Sources
- United Nations Population Division, World Population Prospects 2024, key messages. https://population.un.org/WPP/Publications/Files/WPP2024_Key-Messages.pdf
- International Telecommunication Union, Measuring Digital Development: Facts and Figures. https://www.itu.int
- United Nations, World Urbanization Prospects 2018. https://population.un.org/wup/
- Pew Research Center, generation definitions and US generational population analyses. https://www.pewresearch.org
- Ministry of Health, Labour and Welfare, Japan, vital statistics 2024. https://www.mhlw.go.jp
- Statistics Korea, birth statistics 2024. https://kostat.go.kr
- US Census Bureau, median age at first marriage. https://www.census.gov
- US Bureau of Labor Statistics, unemployment rate. https://www.bls.gov
- Eurostat, youth unemployment rate. https://ec.europa.eu/eurostat