Population affects public budgets through two channels that are often confused. Size changes how many people need services. Age structure changes which services are needed. A state with 100 million residents and a young age profile needs a very different budget from a state with 30 million residents and an aging profile, even if both spend the same share of income.
India’s demographic change is moving these two channels in different directions across regions. National fertility is 1.9 in the Sample Registration System (SRS) Statistical Report 2024, so the child population is shrinking as a share of the total. The India Ageing Report 2023 projects the 60 plus share rising from about 10.5 percent in 2022 to about 20.8 percent in 2050.
Yet large northern states still add young people and workers. Public finance in India is also federal, with states responsible for most spending on health, education, water supply and local services, and the Union government responsible for most tax collection and for transfers through the Finance Commission process.
Why Demographic Change Matters for Government Budgets
Public spending responds to population in several ways. Demand for services follows the number of people in relevant age groups. Unit costs depend on geography, wages and quality. Revenue follows incomes and the tax base, which depend on the economy more than on headcount. Policy choices determine which needs are met.
Three distinctions help:
Need versus actual spending: A state may need to enroll 10 million children in school, but actual spending depends on budgets, teacher posts filled and political priorities. Gaps between need and spending show up as unfilled posts, overcrowded classrooms or weak services.
Per capita spending versus share of output: Per capita spending divides total spending by residents. Spending as a share of state output compares it to the size of the economy. A poor state can spend a high share of output and still spend little per person.
Revenue capacity: Richer states raise more per resident. Transfers from the Union government narrow, but do not close, the gap.
| Concept | Definition | Why it matters |
|---|---|---|
| Expenditure need | Cost of providing a service standard to the relevant population | Basis for planning |
| Actual expenditure | Money spent in the budget | Shows priorities |
| Per capita expenditure | Spending divided by population | Compares states of different size |
| Spending as share of GSDP | Spending relative to state output | Compares effort |
| Revenue capacity | Ability to raise own taxes | Determines room for choices |
Population Growth and the Cost of Public Services
Basic services follow people. Schools, primary health centers, drinking water, sanitation, roads, public transport and housing all require capital and recurring spending that scales with the number of residents. Density and geography change unit costs. Serving a dispersed mountain population in Himachal Pradesh, Uttarakhand or the northeast costs more per person than serving a dense plain district in Bihar or Uttar Pradesh, because schools and clinics need to be smaller and closer to homes.
India has made large investments in rural infrastructure in recent years. The Jal Jeevan Mission raised the share of rural households with tap water connections from under a fifth in 2019 to roughly four fifths by 2024 according to official dashboards. Such programs show that coverage can rise quickly, though maintenance, water quality and recurring costs remain spending commitments.
| Service | Demand driver | Cost driver | Fast growth pressure |
|---|---|---|---|
| Schools | Child population, enrollment | Teacher wages, buildings | Bihar, Uttar Pradesh, Jharkhand |
| Primary healthcare | All residents, with higher needs for mothers, children and elders | Staff, drugs, facilities | Northern states |
| Water and sanitation | Households | Pipes, treatment, maintenance | Fast growing urban areas |
| Urban transport and housing | Urban population | Land, construction | Metros and Tier 2 cities |
| Roads and power | Population and economic activity | Terrain, distances | Hill and tribal districts |
Urbanization adds capital needs. India’s urban share was 31.1 percent in Census 2011, and larger shares by 2027 are likely. Cities need trunk infrastructure before they can collect much revenue, which raises the financing burden on municipal and state governments.
How an Aging Population Could Change Public Expenditure
Aging shifts spending toward health, pensions and care. The Longitudinal Ageing Study in India Wave 1 found that about three in four older adults live with at least one chronic condition. Public support for older adults currently includes the Indira Gandhi National Old Age Pension Scheme under the National Social Assistance Programme, with a central contribution of Rs 200 per month for ages 60 to 79 and Rs 500 for ages 80 and above, unchanged since 2012, plus state top ups. The Ayushman Bharat PM-JAY scheme was extended in 2024 to cover all residents aged 70 and above for hospitalization.
Several different cost drivers get mixed together, and they should be separated.
| Cost driver | Link to aging | Other influences |
|---|---|---|
| Number of older adults | Direct | Fertility, mortality |
| Chronic disease prevalence | Higher with age | Lifestyle, diagnosis, screening |
| Medical prices and technology | Not related to age | Drug and device costs |
| Service intensity and coverage | Partly | Insurance design, supply |
| Pension liabilities | Cohort size and longevity | Past promises, indexation |
| Long term care | Disability, living arrangements | Family structure, migration |
State governments also carry pension obligations for their own employees. States that returned to the old pension scheme in recent years, and states with long established public sector workforces, face large committed spending. Reserve Bank of India State Finances reports track these trends, and readers should consult the latest edition for numbers.
Youthful Populations and Education Spending
Child and youth populations determine school, teacher and skills spending. The 2011 census counted about 29.5 percent of residents as aged 0 to 14. Official projections show this share falling toward roughly a fifth by the mid 2030s. Total school enrollment in the Unified District Information System for Education Plus has fallen from about 26 crore in 2018 to 2019 to roughly 25 crore in recent years, reflecting smaller cohorts and better data cleaning.
The effect differs by state. Kerala, Tamil Nadu, Himachal Pradesh and Punjab are consolidating small schools and facing teacher surplus in some grades. Bihar, Uttar Pradesh, Jharkhand and Madhya Pradesh still need new classrooms, teachers and secondary schools. The Economic Survey and Ministry of Education data suggest combined Union and state spending on education of about 4 percent of GDP, below the 6 percent target in the National Education Policy 2020.
| Education component | Younger states | Older states |
|---|---|---|
| Primary school capacity | Expanding | Consolidating |
| Teacher recruitment | Large vacancies | Redeployment |
| Secondary and higher education | Large unmet demand | Quality and relevance |
| Skills and vocational training | High priority | Retraining of adults |
| Foundational learning | Critical | Still needed |
Spending more is not the same as learning more. ASER 2023 shows weak foundational skills in many states, so spending on teacher training and pedagogy may matter more than additional buildings in some places.
Demographic Change and Healthcare Budgets
Healthcare demand is shaped by population size, age, disease burden and access. National Health Accounts for 2021 to 22 estimated government health expenditure at about 1.8 percent of GDP, about 48 percent of total health expenditure, with out of pocket spending near 39 percent. The National Health Policy 2017 sets a target of 2.5 percent of GDP.
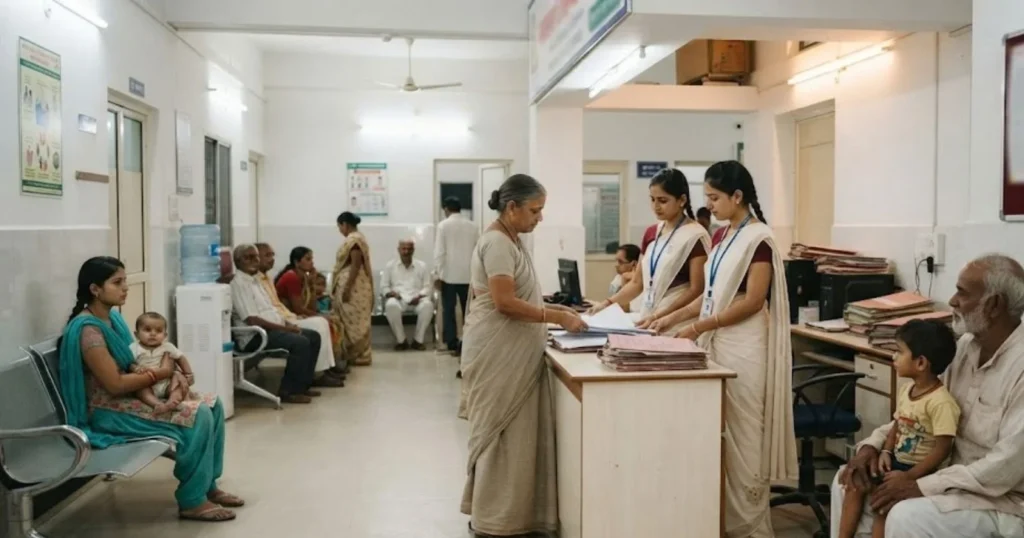
Age alone does not determine health spending. A rural older adult with no nearby facility may use little care and suffer more, while an urban middle class older adult may use a lot. Public health infrastructure, insurance coverage and out of pocket costs affect actual utilization.
| Demand group | Primary need | Where concentrated |
|---|---|---|
| Mothers and newborns | Antenatal care, institutional delivery, newborn care | Bihar, Uttar Pradesh, Madhya Pradesh |
| Children | Immunization, nutrition | Northern and eastern states |
| Working age adults | Non-communicable disease screening | All states |
| Older adults | Chronic disease, geriatrics, long term care | Kerala, Tamil Nadu, Himachal Pradesh, Punjab |
| Rural residents | Primary care access | All states |
Infant mortality shows the unfinished agenda. SRS 2023 reports 37 per 1,000 in Chhattisgarh, Madhya Pradesh and Uttar Pradesh against 5 in Kerala. States with high child mortality need basic maternal and child health spending even as non-communicable diseases rise.
Population Change and Fiscal Transfers Between Governments
Finance Commissions recommend how the divisible pool of central taxes is shared with states. The 15th Finance Commission (2021 to 26) set the states’ share at 41 percent and used these horizontal weights: income distance 45 percent, population (2011 census) 15 percent, area 15 percent, forest and ecology 10 percent, demographic performance 12.5 percent and tax effort 2.5 percent. The 14th Finance Commission had used both 1971 and 2011 population, with weights of 17.5 and 10 percent. The 16th Finance Commission covers 2026 to 2031, and its exact weights should be checked in its report.
Population is one input among several. Income distance gives larger shares to poorer states. Demographic performance was added to avoid penalizing states that lowered fertility. A formula that used only current population would favor large states, while one that used only 1971 population would favor states that were large in 1971.
Approximate shares under the 15th Finance Commission were Uttar Pradesh 17.9 percent, Bihar 10.1 percent, Madhya Pradesh 7.9 percent, West Bengal 7.5 percent, Maharashtra 6.1 percent, Rajasthan 6.0 percent, Tamil Nadu 4.1 percent, Andhra Pradesh 4.1 percent, Karnataka 3.6 percent, Telangana 2.1 percent and Kerala 1.9 percent.
| Criterion | 15th FC weight | Direction of effect |
|---|---|---|
| Income distance | 45% | Favors poorer states |
| Population (2011) | 15% | Favors populous states |
| Area | 15% | Favors large states |
| Forest and ecology | 10% | Favors forested states |
| Demographic performance | 12.5% | Favors states with fertility decline |
| Tax effort | 2.5% | Rewards revenue raising |
Census 2027 will provide a new population baseline for future Finance Commissions, which makes the data cycle a fiscal as well as political event.
Which States May Face the Greatest Spending Pressures?
Pressure comes from need relative to capacity. The table sets out main drivers for selected states. It is a qualitative comparison from the sources above and not a ranking.
| State | Education need | Health and aging need | Urban infrastructure need | Revenue capacity | Notes |
|---|---|---|---|---|---|
| Bihar | Very high | High (maternal, child) | Rising | Low | Large transfers, low per capita spending |
| Uttar Pradesh | Very high | High | High | Low to medium | Scale creates large absolute needs |
| Madhya Pradesh and Rajasthan | High | Medium to high | Medium | Medium | Dispersed rural populations |
| Maharashtra and Gujarat | Medium | Medium | Very high in metros | High | Migrant inflows |
| Karnataka and Telangana | Medium | Medium | Very high in Bengaluru, Hyderabad | High | Fast growing cities |
| Tamil Nadu | Medium | High | High | High | Aging and industrial state |
| Kerala | Medium to low | Very high | Medium | Medium | Pension and elder care |
| Punjab and Himachal Pradesh | Low to medium | High | Medium | Low to medium | Pension and debt constraints |
Geographic service costs raise needs in hill states and tribal districts. Debt and fiscal deficit ceilings under state fiscal responsibility laws limit borrowing, so states with high debt face harder trade offs.
Can Better Data Improve Demographic Budget Planning?
Better data can reduce mismatches between need and spending. Four sources are central: population projections, administrative data, service utilization and geographic data.
Population projections by age and district guide school and clinic planning. Administrative data on enrollment, teacher postings, health facility visits and pension rolls show where services are used. Utilization data from surveys such as NFHS and the National Sample Survey show who uses public versus private services. Geographic information systems help locate facilities relative to residents.
| Data source | Use in budgeting | Limit |
|---|---|---|
| Census 2027 | Baseline counts, age and migration | Delayed release of tables |
| SRS and NFHS | Fertility, mortality, health | Sample based, state level |
| UDISE Plus | School enrollment, teachers | Administrative quality varies |
| PLFS | Employment, migration | Annual and quarterly samples |
| State budgets and RBI reports | Spending by function | Classification differences |
Transparent budget reporting, including outcome budgets and demographic annexes, would let citizens and legislators judge whether allocations follow need.
India’s Public Spending Outlook Through 2050
Demographic demand is not the same as a spending forecast. A plausible set of scenarios combines demographic projections with assumptions on growth, wages, service coverage and policy.
| Scenario | Assumptions | Spending implication |
|---|---|---|
| Steady growth, steady coverage | Moderate GDP growth, current service levels | Education share falls, health and pension shares rise |
| Expanded coverage | Higher health and elder care spending, indexed pensions | Faster rise in social spending, needs revenue growth |
| Slow growth | Weak revenue, constrained borrowing | Service gaps widen, especially in poor states |
| Strong growth and productivity | Higher incomes, wider tax base | Room for both youth and elder investment |
Under all scenarios the composition shifts: education per cohort stabilizes or declines as a share of spending in aging states, while health, social protection and urban infrastructure rise. The UN projects India’s population to peak in the early 2060s, which means that demands from a large population continue for decades even as the age mix changes.
Frequently Asked Questions
1. Does a larger population always require a larger government budget?
Not proportionally. Costs depend on age structure, geography, unit costs, coverage and policy choices.
2. Will India’s aging population increase government spending?
It raises demand for healthcare, pensions and care, but prices, technology and insurance design also drive costs.
3. How does population affect Finance Commission transfers?
Population enters as one criterion, with a 15 percent weight in the 15th Finance Commission formula, alongside income distance, area, forest cover, demographic performance and tax effort.
4. Why do some states spend more per person than others?
Differences come from revenue capacity, needs, costs, transfers and fiscal policy.
5. How can governments prepare for demographic change?
Through district level projections, transparent budgeting, infrastructure planning and monitoring of service outcomes.
6. How much does India spend on health?
Government health expenditure was about 1.8 percent of GDP in National Health Accounts 2021 to 22.
7. How much does India spend on education?
About 4 percent of GDP across Union and states in recent estimates, below the 6 percent target.
8. What is demographic performance in the Finance Commission formula?
A criterion rewarding states that reduced fertility, with a 12.5 percent weight in the 15th Finance Commission.
9. Do younger states or older states spend more?
It varies. Younger states spend more on education and maternal health, older states on pensions and elder care.
10. Why is the 2027 census important for budgets?
It will update the population baseline used in transfers and planning.
Sources and Data Notes
- Finance Commission of India, 14th, 15th and 16th reports; Ministry of Finance, Union Budget and Economic Survey.
- Ministry of Health and Family Welfare, National Health Accounts 2021 to 22; National Health Policy 2017.
- Ministry of Education, UDISE Plus; National Education Policy 2020; ASER 2023.
- UNFPA and IIPS, India Ageing Report 2023; Longitudinal Ageing Study in India Wave 1.
- Reserve Bank of India, State Finances reports; SRS 2023 and 2024; Census 2011.
- Data note: shares and weights are quoted from Finance Commission reports. Verify the 16th Finance Commission weights and latest budget figures.