For every 100 adults of working age, Japan supports about 49 people aged 65 and over, while Nigeria supports about 6 but about 78 children under 15. Both ratios are called dependency, and both describe a burden, yet they point to very different bills: pensions and long-term care in one country, schools, jobs and maternal health in the other. A single “generational burden” does not exist. What exists is a set of pressures that fall on different age groups at different times, and that vary sharply by country.
No standard international index measures generational burden, so this article builds one from observable indicators: dependency ratios, pension and health spending, caregiving hours, housing, wealth and climate exposure. It separates what has been measured from what is projected, and it avoids ranking generations from worst to best off, because the ranking changes with the indicator.
Data Snapshot
| Indicator | Figure | Year | Source |
|---|---|---|---|
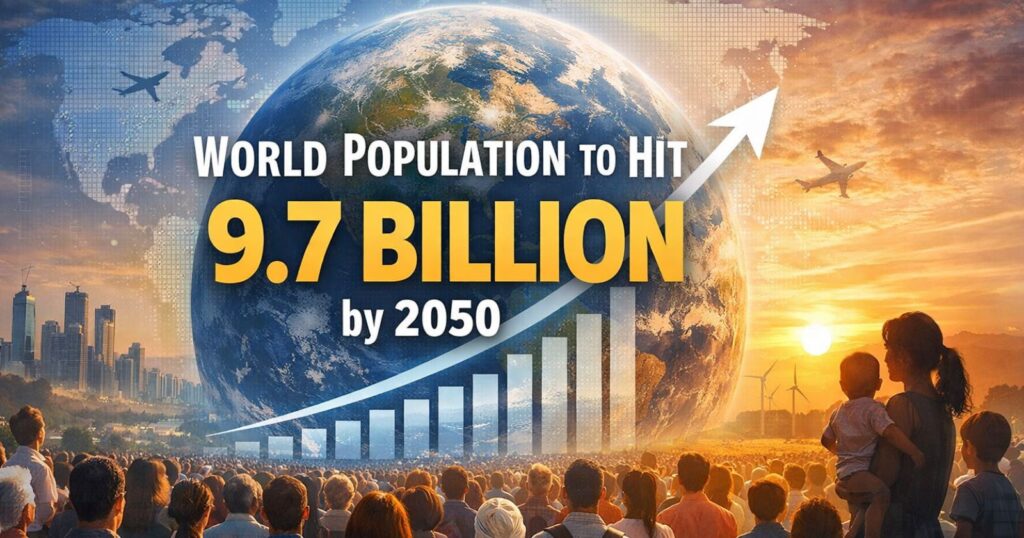
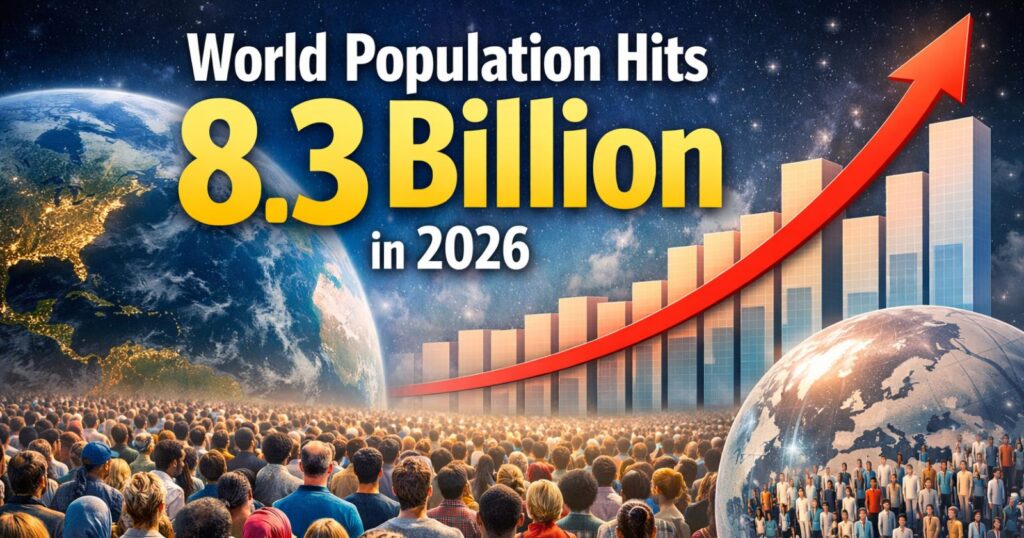
| World population | 8.2 billion; 9.7 billion projected | 2024; 2050 | UN WPP 2024 |
| People aged 65+ outnumber children under 18 | By 2080 | Projection | UN WPP 2024 |
| Global population aged 65+ in the late 2070s | 2.2 billion | Projection | UN WPP 2024 |
| World life expectancy | 73.3 years | 2024 | UN WPP 2024 |
| Share of unpaid care work done by women | About 76% | 2018 | ILO |
| People in contexts highly vulnerable to climate change | 3.3 to 3.6 billion | 2022 | IPCC AR6 |
What Does Generational Burden Actually Mean?
Burden here means a set of demographic, economic and environmental responsibilities that fall unevenly across age groups. Four components can be measured:
- Demographic dependency, the number of children and older people per 100 working-age adults.
- Fiscal transfers, such as public pension and health spending financed by current workers.
- Family care, mainly unpaid, for children and older relatives.
- Inherited conditions, including housing costs, public debt and climate exposure.
Dependency is not the same as economic dependence. Many people over 65 work, and many 15-to-64-year-olds are not employed. Individual responsibility also differs from population-wide pressure: a country can face rising pension costs while a particular 45-year-old has no caregiving duties at all.
Which Generations Will Face the Biggest Demographic Responsibilities?
| Generation | Age in 2026 | Main demographic position |
|---|---|---|
| Baby Boomers | 62 to 80 | Retiring; rising health and care needs |
| Generation X | 46 to 61 | Late career; caring for parents and supporting children |
| Millennials | 30 to 45 | Peak parenting and mid-career; paying into pension systems |
| Generation Z | 14 to 29 | Entering education and work; housing and early career costs |
| Generation Alpha | 0 to 13 | Schooling now; the main working-age cohort around 2050 |
Position in the life course matters more than birth year. In 2050, millennials will be 54 to 69 and moving toward retirement, so the generation carrying parental care today becomes the one drawing on pensions later.
The Population Aging Challenge
A Growing Older Population
The 65-and-over share of world population was about 6% in 1990, about 10% in 2024 and is projected near 16% in 2050. By the late 2070s the UN expects 2.2 billion people aged 65 or older, more than the number of children under 18.
The Changing Ratio Between Working Age and Older People
| Country | Youth dependency (0 to 14 per 100 aged 15 to 64) | Old-age dependency (65+ per 100) | Total |
|---|---|---|---|
| Japan | 19 | 49 | 68 |
| Germany | 21 | 36 | 57 |
| United States | 27 | 28 | 55 |
| South Korea | 15 | 27 | 42 |
| China | 24 | 23 | 47 |
| India | 35 | 10 | 45 |
| Nigeria | 78 | 6 | 84 |
Approximate values for 2024, rounded, calculated from UN and national age structures. The total in Nigeria is the highest on the table, but it is nearly all youth dependency, which is a very different obligation from Japan’s.
Old-age dependency ratios overstate need where older adults work and understate it where retirement is early. Raising the retirement age from 65 to 67 changes the measured ratio materially without any change in demographics.
Healthcare and Long-Term Care Requirements
Care needs rise steeply after 80, and the UN projects that the 80-and-over population will roughly triple by 2050 from about 150 million in the early 2020s. Health spending already reached about 17% of US GDP in 2022 according to US national health expenditure accounts. The workforce needed for long-term care is itself aging in several countries.
The Impact on Families
Smaller families mean fewer adult children per older parent. Pew found 47% of US adults in their forties and fifties in 2013 had a living parent aged 65 or older and either a child under 18 or an adult child they supported. The ILO estimates women do about 76% of unpaid care hours worldwide, so caregiving falls disproportionately on women in the middle generations.
The Future Workforce and Economic Dependency
The working-age population stops growing first in the oldest countries. China’s population is projected to fall by about 200 million, or 14%, between 2024 and 2054, and its working-age group shrinks faster. In 63 countries and areas, accounting for 28% of the world’s population, the population has already peaked, according to the UN. Participation, productivity and migration can offset some of the loss, but evidence of how much is mixed. Automation may reduce labor demand in some sectors while shortages persist in care and construction.
The Financial Burden of Intergenerational Support
Pensions and Retirement Funding
Public pension spending averages roughly 9% of GDP across OECD countries and exceeds 14% in Italy and Greece, according to OECD estimates. Many governments are raising retirement ages: US full retirement age is 67 for those born after 1959, and OECD normal pension ages for new entrants are rising toward about 66. ILO figures show about three-quarters of people above retirement age worldwide receive some pension, with much lower coverage in low-income countries.
Healthcare Spending and Public Budgets
Systems financed by payroll taxes or general revenue depend on the size of the working-age base. In countries with small younger cohorts, per-worker costs rise faster than in countries with growing cohorts, unless productivity rises too.
Public Debt and Intergenerational Transfers
Public debt is not equivalent to an individual debt for any future taxpayer, since governments can refinance and economies grow. Burden depends on how the debt is serviced, who pays taxes and what the borrowing financed. Transfers also run in both directions: parents give to adult children for housing, and adult children provide care.
Wealth Inequality Between Generations
Federal Reserve distributional accounts have placed roughly half of US household net worth with baby boomers, about a quarter to a third with Gen X and about a tenth with millennials in recent quarters. Age explains a large share, since older households have had more time to accumulate. Inflation-adjusted, age-matched comparisons are more informative: the median US first-time home buyer was 40 in 2025 (NAR), against the upper twenties in the 1980s.
Housing Affordability and the Family Formation Challenge
Housing costs affect when young adults form households. In the EU, house prices rose 55.4% and rents 26.7% from 2010, and 9.7% of those aged 15 to 29 lived in households spending 40% or more of income on housing in 2024, against 8.2% of the whole population (Eurostat). The links to marriage and fertility are plausible but vary by country, and housing costs are one of several factors, along with employment and childcare.
The Shrinking Workforce and the Future of Productivity
Where workforces shrink, output depends on productivity growth, later retirement and migration. Japan’s labor force participation among older adults is high, and Korea’s employment rate for people over 65 is among the highest in the OECD, which shows that older workers can offset part of the decline. Countries with growing workforces face the reverse test: Nigeria and India must create jobs at a pace that matches annual entrants into the labor market.
Climate Change and Environmental Responsibilities
The IPCC’s Sixth Assessment Report estimates that 3.3 to 3.6 billion people live in contexts highly vulnerable to climate change. A 2021 study in the journal Science (Thiery and colleagues) estimated that a child born in 2020 would face roughly seven times as many heatwaves across a lifetime as someone born in 1960 under current policy pledges. Exposure differs by country and income, and adaptation costs fall on public budgets that are also supporting aging populations. Attributing any specific future outcome to a particular generation is not supported by the evidence.
The Global Divide in Generational Burdens
| Group | Principal pressures | Example |
|---|---|---|
| Aging economies | Pensions, long-term care, workforce shortages | Japan, Italy, South Korea |
| Young, rapidly growing populations | Schools, jobs, infrastructure, maternal and child health | Nigeria, Niger |
| Mixed cases | Aging alongside unemployment or inequality | China, Brazil, parts of Eastern Europe |
Countries in the third group face both sets of pressures at once, often with lower income than the aging economies had when they aged.
How Generational Burdens Differ by Gender and Income
Women do about 76% of unpaid care hours worldwide, so the cost of caring shows up in lower paid work hours, lower pension accumulation and lower retirement income. Income cuts across generation: a lower-income Gen X household with no pension wealth and a parent needing care faces a very different burden from a high-income peer. Disability, education and geography add more variation.
Can Demographic Change Become an Opportunity?
Evidence supports several offsetting levers. Higher education and employment participation raise the output of each worker. Migration adds working-age adults, and the UN expects immigration to moderate population decline in 50 countries. Pension reform and longer working lives reduce fiscal pressure. Healthier aging can reduce care needs per person. Each has costs and trade-offs, and none has been shown to eliminate the pressure by itself. Outcomes depend on policy choices that this article does not rank.
Which Generation Could Face the Most Complex Set of Challenges?
| Indicator | Boomers | Gen X | Millennials | Gen Z | Alpha |
|---|---|---|---|---|---|
| Health and care needs | High, rising | Rising later | Low | Low | Low |
| Caregiving duties | Often as spouse | Highest as a group | Rising | Low | None |
| Wealth position | Highest | Middle | Lower at same age | Early stage | n/a |
| Housing access | Mostly owners | Mostly owners | Delayed | Delayed | Future |
| Climate exposure over lifetime | Lowest | Moderate | Higher | Higher | Highest |
| Fiscal support role in 2050 | Beneficiary | Beneficiary | Mixed | Main payers | Main payers |
A table of indicators in place of a single score is deliberate. Gen X carries the heaviest short-term caregiving load, millennials the largest housing delay, and Alpha the longest exposure to climate risk. Within each generation, income, gender and country move the picture more than birth year does.
What the Future of Intergenerational Responsibility May Look Like
Projections point to a world in which the number of older adults grows faster than any other group, and family-based care is supplemented or replaced by paid care in some countries. Retirement ages are likely to continue rising in aging economies, and fertility is projected to keep falling toward and below replacement in most countries. Anything beyond these trends, such as changes in how households share support, remains speculation.
Conclusion
The data support a narrower claim than “one generation inherits the worst of it”: each generation holds a distinct set of pressures at a different moment, and national context dominates birth year. The most consistent trend is the rise of old-age dependency, which is projected to push people aged 65 and over beyond the number of children by 2080. How heavy that becomes for any one generation will depend on retirement rules, productivity and migration decisions made over the next two decades.
Key Findings
- Japan has about 49 people aged 65 and over per 100 working-age adults, against about 6 in Nigeria, where youth dependency of about 78 is the dominant burden.
- By 2080 people aged 65 and over are projected to outnumber children under 18 worldwide, with 2.2 billion people aged 65 or older in the late 2070s.
- Women do about 76% of unpaid care hours, which concentrates caregiving costs in the middle generations.
- Roughly half of US household wealth is held by boomers and about a tenth by millennials, partly an age effect.
- A child born in 2020 may face about seven times as many heatwaves as someone born in 1960 under current pledges.
Frequently Asked Questions
1. What is generational burden?
A set of demographic, economic and environmental responsibilities that fall unevenly across age groups. No standard index exists, so it is measured through indicators such as dependency ratios and care hours.
2. Which generation faces the greatest demographic challenges?
It depends on the indicator and country. Gen X has the heaviest caregiving load, millennials the largest housing delay and Alpha the longest climate exposure.
3. How does population aging affect younger generations?
Through payroll taxes and public budgets for pensions and health, through family caregiving and through a smaller or larger workforce. Effects vary by pension design and by country.
4. Will millennials have to support more older people?
Old-age dependency ratios will rise as millennials age, but actual support depends on retirement ages, pension rules, employment and productivity.
5. What demographic problems will Generation Z inherit?
Aging populations in many countries, housing costs, longer exposure to climate risks and a smaller workforce in low-fertility countries. In high-fertility countries the issues are job creation and services for large youth cohorts.
6. How does a declining birth rate affect the workforce?
Fewer births produce smaller entry cohorts 15 to 20 years later. Participation, productivity and migration can offset some of the effect.
7. Can migration reduce demographic pressures?
It adds working-age adults and the UN expects it to moderate population decline in 50 countries. It does not remove the effect of low fertility, and it carries political and integration considerations.
8. How can countries prepare for generational demographic change?
Evidence supports investment in education, healthier aging, longer working lives, pension reform and long-term care financing. Evidence on their relative effectiveness is mixed.
9. What is the old-age dependency ratio?
The number of people aged 65 and over per 100 people aged 15 to 64. It was about 49 in Japan and about 6 in Nigeria in 2024, by rounded estimates.
10. Is public debt a burden on future generations?
Not automatically. The effect depends on interest rates, economic growth, what was financed and who pays future taxes.
Sources
- United Nations Population Division, World Population Prospects 2024.
- International Labour Organization, World Social Protection Report and care work estimates.
- IPCC, Sixth Assessment Report, Working Group II (2022). https://www.ipcc.ch
- Thiery, W. and colleagues, “Intergenerational inequities in exposure to climate extremes,” Science (2021). https://www.science.org
- Federal Reserve Board, Distributional Financial Accounts. https://www.federalreserve.gov
- National Association of Realtors, 2025 Profile of Home Buyers and Sellers.
- Eurostat, young people housing conditions (2025).
- Pew Research Center, sandwich generation analysis (2013). https://www.pewresearch.org
- US Centers for Medicare and Medicaid Services, National Health Expenditure data. https://www.cms.gov