
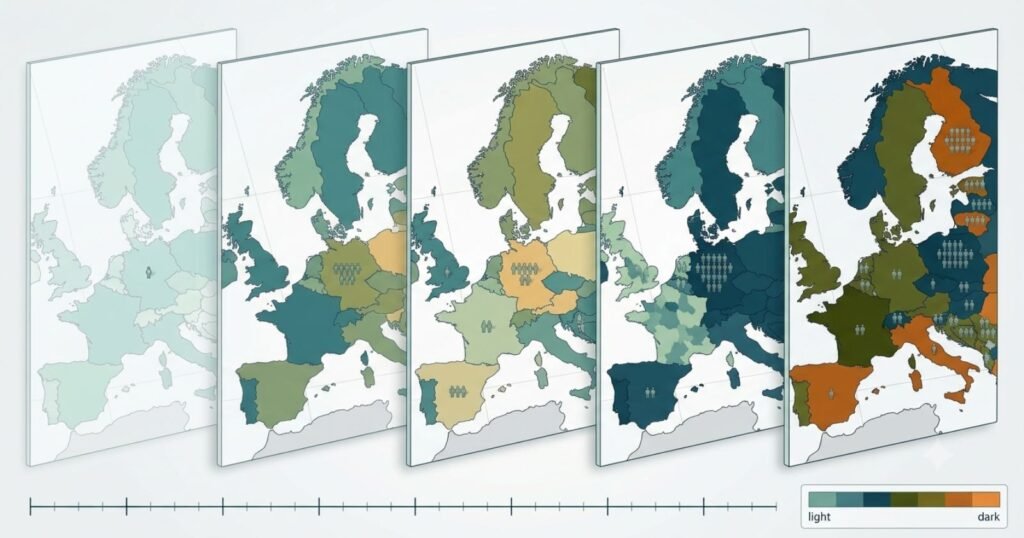
Europe’s population fell by roughly 916,000 people in the twelve months to mid-2026, a decline of 0.12 percent. That single continental number hides an enormous range underneath it. Gibraltar grew by 1.85 percent. Moldova and Lithuania each shrank by 1.16 percent. Twenty-one of Europe’s 47 counted countries and territories are losing population right now, while the other 26 are gaining it, often for completely different reasons.
The Equation Behind Every Number
Every population growth figure in this piece comes from the same basic accounting identity used by demographers everywhere.
Population change = births minus deaths, plus immigration minus emigration
The first half of that equation is called natural change. The second half is net migration. A country can grow through natural change alone, through migration alone, through both together, or it can shrink on one side while growing on the other and still post overall growth, which is exactly what is happening across most of Western Europe right now.
Europe’s Growth Rate at a Glance
| Metric | 2026 Value |
|---|---|
| Total population | 743,482,361 |
| Yearly change | -0.12% |
| Net change | -916,471 people |
| Average net migration | +1,299,979 people |
| Fertility rate | 1.41 children per woman |
| Median age | 43.1 years |
| Countries growing | 26 of 47 |
| Countries shrinking | 21 of 47 |
Source: UN World Population Prospects 2024 Revision, medium-fertility variant, elaborated by Worldometer.
The fact that net migration into Europe was strongly positive, nearly 1.3 million people, while total population still fell is the single most important number in this article. It means natural change, births minus deaths, was negative by well over 2 million, and migration only covered part of that shortfall. This has not always been the case, and understanding when it changed is the key to understanding where Europe’s demographics are actually heading.
Europe’s Population Growth Since 1950, in Five Eras
| Period | Approx Growth Rate | Primary Driver | What Was Happening |
|---|---|---|---|
| 1950s to 1960s | +0.9% to +1.0% per year | Natural increase | Postwar baby boom, fertility above 2.5 |
| 1970s | +0.5% to +0.7% per year | Natural increase, slowing | Fertility transition begins, contraception spreads |
| 1980s to 1990s | +0.1% to +0.4% per year | Shift toward migration | Fertility falls below replacement, migration turns positive |
| 2000s to 2010s | +0.1% to +0.2% per year | Migration dominant | EU enlargement, refugee movements, natural change turns negative |
| 2020s | -0.1% to -0.3% per year | Migration insufficient | Deaths regularly exceed births faster than migration can offset |
This is the demographic turning point in one row. Europe moved from a population sustained by births to one sustained by migration to, most recently, a population where even strong migration cannot fully offset natural decline.
Europe’s Fastest Growing Countries
| Rank | Country | Yearly Growth Rate | Net Migration Contribution |
|---|---|---|---|
| 1 | Gibraltar | +1.85% | Strongly positive, financial services workforce |
| 2 | Ukraine* | +1.43% | Wartime displacement and return movement |
| 3 | Luxembourg | +1.03% | Strongly positive, EU institution and finance workers |
| 4 | Andorra | +1.02% | Positive, tourism and retiree inflows |
| 4 | Iceland | +1.02% | Positive, labor migration |
| 6 | Faroe Islands | +0.94% | Positive, fisheries and return migration |
| 7 | Ireland | +0.92% | Strongly positive, tech and pharma sector jobs |
| 8 | Malta | +0.66% | Positive, financial and gaming sector migration |
| 9 | Liechtenstein | +0.60% | Positive, cross-border finance workers |
| 10 | United Kingdom | +0.55% | Positive, offsets a near-zero natural change |
*Ukraine’s figure reflects wartime statistical disruption rather than a conventional growth pattern and should be read with caution.
Every country in this top ten except Ukraine is growing primarily or entirely through migration, not births. Several, including Luxembourg, Iceland, and Ireland, actually pair positive migration with fertility rates below replacement level, meaning that without continued inward migration, all of them would already be shrinking from natural change alone.
Europe’s Fastest Shrinking Countries
| Rank | Country | Yearly Decline Rate | Primary Cause |
|---|---|---|---|
| 1 | Moldova | -1.16% | Emigration of working-age population toward Western Europe |
| 1 | Lithuania | -1.16% | Emigration plus fertility well below replacement |
| 3 | Montenegro | -1.03% | Emigration and low fertility |
| 4 | Estonia | -0.98% | Low fertility, modest emigration |
| 5 | Latvia | -0.95% | Emigration since EU accession, low fertility |
| 6 | Bosnia and Herzegovina | -0.82% | Sustained emigration, weak economic growth |
| 7 | Poland | -0.78% | Post-2004 EU emigration wave, low fertility |
| 8 | Czechia | -0.77% | Low fertility, aging population |
| 9 | Albania | -0.74% | Long-running emigration, especially to Italy and Greece |
| 10 | Serbia | -0.70% | Emigration, low fertility |
| 10 | Bulgaria | -0.70% | Among the lowest fertility rates in Europe, sustained emigration |
The countries at the top of this list share a specific profile, mid-sized economies in Central, Eastern, and Southeastern Europe where younger, working-age residents have been leaving for higher wages elsewhere in Europe for two decades or more, a pattern that accelerated sharply after EU accession opened free movement for several of these countries in 2004 and 2007.
Why Some Countries Grow Despite Low Fertility
This looks contradictory at first glance, a country with a fertility rate of 1.4, well below the 2.1 needed to hold population steady, can still show positive population growth. Four mechanisms explain it.
- Migration can more than offset a natural deficit, which is exactly the case in Ireland, Luxembourg, and the UK
- Population momentum means a country with a historically large number of women in childbearing age still produces more births than deaths for a period even as the fertility rate itself falls, a lagging effect from an earlier, higher-fertility generation
- Rising life expectancy slows the growth of the death rate even as the population ages, delaying the point at which deaths overtake births
- Urbanization and economic opportunity concentrate population gains in specific cities and regions even when the national rural picture is one of decline
Why Some Countries Shrink Despite Positive Migration
The mirror image also holds. A country can receive net positive migration and still shrink overall if natural decline is large enough to outweigh it. This is increasingly the pattern across much of Central and Southeastern Europe, where an aging population structure, the product of decades of low fertility, means the pool of people dying each year now substantially exceeds the pool being born, and the migration Europe as a whole is receiving is not evenly distributed, concentrating instead in Western and Northern European economies rather than the countries losing population fastest.
Natural Change Deep Dive
Europe’s fertility rate sits at 1.41 children per woman in 2026, well below the 2.1 replacement threshold. No large European country currently has a fertility rate at or above replacement level. France, at 1.6, and Romania and Bulgaria, at 1.7, sit toward the higher end of the range, while Malta, at 1.1, Ukraine, at 1.0, and Andorra, at 1.1, sit at the very bottom. Combined with a median age of 43.1 and climbing, the structural pressure on natural change is toward continued negative territory for the foreseeable future, regardless of any single year’s birth rate fluctuation.
Migration Deep Dive
Net migration into Europe averaged nearly 1.3 million people in 2026, continuing a pattern that has held since the early 2000s, with migration functioning as Europe’s primary population growth mechanism for over two decades. That migration is not evenly spread. The UK, Germany, Ireland, Switzerland, and the Nordic countries receive the largest absolute and proportional inflows, driven by labor demand, EU and non-EU immigration policy, and, in the UK’s case specifically, migration levels large enough to turn an otherwise roughly flat natural change into consistent overall growth.
Economic Consequences of Europe’s Growth Pattern
A population growing through migration rather than births has different economic implications than one growing through natural increase. Migration-driven growth tends to add working-age adults directly to the labor force immediately, which helps offset near-term labor shortages and pension funding gaps. But it does not on its own reverse the underlying age structure problem, since migrants themselves age over time and, in many cases, adopt fertility patterns closer to their destination country’s within a generation or two.
Countries relying most heavily on migration for growth, including Ireland, Luxembourg, and the UK, still face rising dependency ratios in the coming decades, just on a longer timeline than countries with negative migration and negative natural change combined.
Growth Rate Forecast to 2050
| Year | Annual Growth Rate | Population | Migration Contribution |
|---|---|---|---|
| 2026 | -0.12% | 743.5 million | +1.30 million |
| 2030 | -0.16% | 738.4 million | +1.19 million |
| 2035 | -0.21% | 730.6 million | +1.14 million |
| 2040 | -0.23% | 722.1 million | +1.09 million |
| 2045 | -0.25% | 713.3 million | +1.09 million |
| 2050 | -0.29% | 703.0 million | +1.08 million |
Under the UN’s medium-fertility, medium-migration scenario, Europe’s rate of decline actually accelerates slightly through 2050 even as absolute net migration stays roughly stable, because the natural deficit, driven by an aging population reaching its highest death rates yet, grows faster than migration can keep pace with.
Three Scenarios for Europe’s Demographic Future
- High scenario, fertility recovers modestly toward 1.7 to 1.8, and migration policy remains open, in which case Europe’s population could stabilize closer to 730 to 740 million through 2050 rather than falling to 703 million
- Medium scenario, the UN’s central projection used throughout this article, fertility stays near 1.4 to 1.5, migration continues near current levels, population falls to roughly 703 million by 2050
- Low scenario, fertility falls further and migration policy tightens across major receiving countries, in which case Europe’s population could fall below 680 million by 2050, a decline of nearly 10 percent from today
Frequently Asked Questions
Is Europe’s population growing or declining in 2026?
Declining. Europe’s total population fell by about 0.12%, or roughly 916,000 people, in the year to mid-2026.
Which European country has the fastest population growth?
Gibraltar, at +1.85% annually, tops the list among fully counted territories, followed by Luxembourg and Iceland among larger economies.
Which European country is shrinking fastest?
Moldova and Lithuania, both declining at -1.16% per year.
Why is Europe’s population falling if migration is still positive?
Because natural change, births minus deaths, is negative by a wider margin than migration can offset. Europe’s fertility rate of 1.41 sits well below the replacement level of 2.1.
Will Europe’s population growth rate turn positive again?
Under the UN’s medium scenario used in this article, no, the rate of decline is projected to gradually deepen through 2050. A return to growth would require a substantial rise in fertility, migration, or both beyond current trends.
Sources
- United Nations, Department of Economic and Social Affairs, Population Division,
- World Population Prospects 2024 Revision, medium-fertility variant.
- Supplementary country growth-rate cross-check based on The World Factbook, Central Intelligence Agency, 2025 estimates.





