
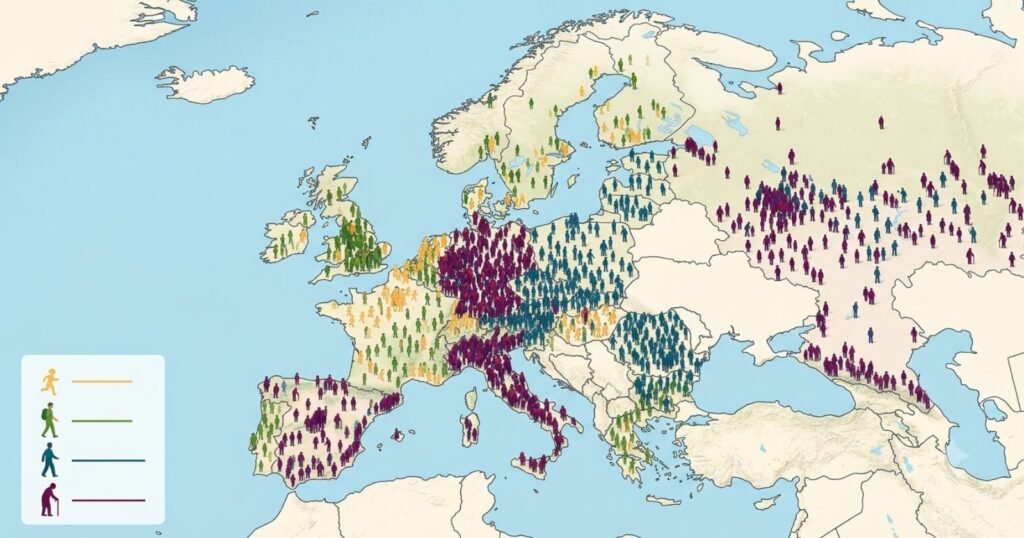
In 1960, roughly one in four Europeans was a child under 15. Today that figure is closer to one in seven, while the share aged 65 and over has climbed past one in five and keeps rising. Europe has not just gotten a bit older: its entire population structure has inverted, from a pyramid with a wide young base to something closer to a column, or in the fastest-aging countries, an upside-down pyramid with more weight at the top than the bottom. This article walks through exactly how that inversion happened, one age band at a time.
A Note on the Data in This Article
Two data sources are used here and they measure slightly different populations. Continent-wide figures, total population and median age, come from UN World Population Prospects via Worldometer and cover all 47 European countries and territories used elsewhere in this series. The detailed age-band breakdown, under-15, working-age, and 65-plus shares, comes from Eurostat and covers the 27 EU member states specifically, since Eurostat publishes the most granular, consistently measured age-structure data available for Europe. Where a figure is EU-specific rather than pan-European, it is labeled as such.
Europe’s Age Structure at a Glance
| Age Band | Approx Share of EU Population, 2025 | Approx Population |
|---|---|---|
| 0 to 14 | 14.4% | 65 million |
| 15 to 64 | 63.6% | roughly 287 million |
| 65 and over | 22.0% | 99 million |
Source: Eurostat, EU-27, 1 January 2025. Europe’s continent-wide median age, across all 47 countries and territories, stands at 43.1 years in 2026, up from 33.6 in 1990 and projected to reach 46.2 by 2050.
Why Europe Is Aging
Four forces are doing the work here, and they are stacking, not offsetting each other. Fertility across the EU has fallen from an average well above 2.5 children per woman in the 1960s to roughly 1.4 to 1.5 today, far below the 2.1 needed to hold a population’s age structure steady. Life expectancy has climbed from the low 70s in the 1960s to nearly 82 years today, meaning people spend far more years in the older age brackets than any previous generation.
The large postwar baby boom generation, born roughly between 1946 and 1964, is now moving through its late 60s, 70s, and 80s, swelling the 65-plus band all at once rather than gradually. Migration adds younger working-age adults on net, but not in numbers large enough to meaningfully offset the other three forces.
The Age Pyramid, 1960 Versus Today
| Year | Under 15 | 15 to 64 | 65 and Over |
|---|---|---|---|
| 1960 | approx 24% | approx 65% | approx 11% |
| 1990 | 18.6% | 67.2% | 14.1% |
| 2000 | 16.9% | 67.4% | 15.7% |
| 2010 | 15.4% | 66.9% | 17.7% |
| 2020 | 15.0% | 64.3% | 20.7% |
| 2024 | 14.4% | 63.6% | 22.0% |
| 2025 | 14.4% | 63.6% | 22.0% |
Source: Eurostat, EU-27 historical age distribution series. 1960 figure is an approximate reconstruction consistent with the long-run Eurostat trend; all other years are directly reported values.
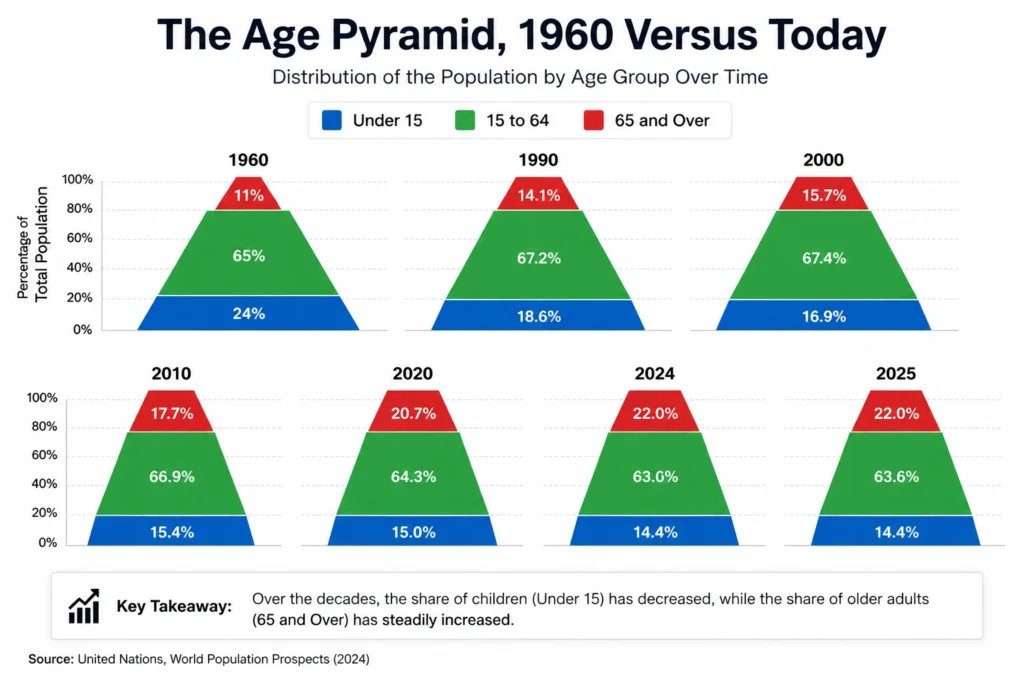
The two lines that matter most in this table are the under-15 share, which has been cut nearly in half since 1960, and the 65-plus share, which has roughly doubled. The working-age share actually held remarkably steady, drifting between 63 and 67 percent for six decades, because it absorbs people aging out of childhood on one side and people aging into retirement on the other. That steadiness is ending now, as the large baby boom cohort exits the working-age band faster than smaller younger cohorts can replace it.
Children and Adolescents
Children under 15 made up 14.4 percent of the EU population in 2025, down from 24 percent in 1960. The decline has not been uniform. Ireland, at 18.5 percent, has by far the highest child share in the EU, followed by Sweden at 16.8 percent and France at 16.6 percent. At the other end, Italy sits at just 11.9 percent, with Malta at 12.1 percent and Portugal at 12.6 percent, meaning Italy now has proportionally about 36 percent fewer children than Ireland relative to its total population. Widening the lens slightly, young people under 19 made up about 20 percent of the EU in 2025, with Ireland again topping the list at nearly 25 percent, alongside France and Sweden at 23 percent each.
The Working-Age Population
The 15 to 64 band, the group demographers typically treat as the core labor force, stood at 63.6 percent of the EU population in 2025, down from a peak around 67.4 percent in the early 2000s. That three to four percentage point drop matters enormously for labor markets and pension financing, because it is not a temporary dip, it is the leading edge of the baby boom generation moving out of this band and into the 65-plus category faster than younger cohorts are entering at the bottom. Migration is the main lever available to slow this shift, since most migrants arrive within working age, but the scale of migration needed to fully offset the boomer exit is far larger than current inflows.
Europe’s Older Population
The 65-plus population reached 99 million people across the EU in 2025, or 22.0 percent of the total, up 2.9 percentage points in just ten years. Within that group, the oldest-old, those 80 and above, are growing fastest of all, since this is the cohort now being reached by people born in the immediate postwar boom years and benefiting from decades of improving late-life survival. This sub-group matters disproportionately for healthcare and long-term care planning, since demand for intensive elder care rises sharply past age 80 rather than climbing steadily from 65 onward.
Median Age by Country
| Country Group | Median Age 2026 | Example Countries |
|---|---|---|
| Youngest in Europe | 37 to 39 years | Iceland (37), Faroe Islands (37), Albania (38), Ireland (39) |
| Mid-range | 40 to 43 years | UK (40), Sweden (40), Norway (40), Ukraine (42), Belgium (42) |
| Older | 44 to 47 years | Czechia (44), Austria (44), Hungary (44), Portugal (47), Greece (47) |
| Oldest in Europe | 48 years and above | Italy (49), San Marino (49), Monaco (53), Holy See (56) |
Source: UN World Population Prospects 2024, 2026 country-level figures.
Italy is the clearest large-country case study in aging. At a median age of 49, half of all Italians are older than someone who, in most of the rest of the world, would just be settling into their peak working years. Ireland sits at the opposite extreme among sizable countries, with a median age of 39, a full decade younger than Italy, driven by comparatively higher fertility and a young, migration-fed workforce tied to its tech and pharmaceutical sectors.
Europe’s Youngest Versus Oldest Populations, Two Contrasting Profiles
Ireland’s population pyramid still resembles a rectangle with a modest bulge at the base, roughly 18.5 percent under 15, a large working-age middle, and a comparatively small 65-plus band relative to the EU average. Italy’s pyramid, by contrast, has already begun to invert, a narrow base under 12 percent, a working-age band that is itself aging rapidly toward retirement, and a swollen older population approaching a quarter of the total. If current trends hold, Italy’s structure previews what a growing number of Central and Southern European countries, including Portugal, Greece, and Bulgaria, are likely to look like within a decade or two.
The Dependency Ratio Problem
The old-age dependency ratio measures how many people of working age exist for every person aged 65 and over. The EU-wide ratio stood at 34.5 percent in 2025, meaning there were just over 3 working-age people for every person 65-plus. That ratio varied enormously by country.
| Country | Old Age Dependency Ratio 2025 | Working Age People per Older Person |
|---|---|---|
| Luxembourg | 22.0% | Almost 5 to 1 |
| Ireland | 23.8% | About 4.2 to 1 |
| Malta | 26.6% | About 3.8 to 1 |
| EU average | 34.5% | About 2.9 to 1 |
| Portugal | 38.6% | About 2.6 to 1 |
| Bulgaria | 38.7% | About 2.6 to 1 |
| Italy | 39.0% | About 2.6 to 1 |
Source: Eurostat, EU-27, 1 January 2025. A simple worked example makes the ratio concrete. In Luxembourg, roughly 5 working-age adults collectively support the pension and healthcare costs tied to each retiree. In Italy, that support base has shrunk to just 2.6 working-age adults per retiree, meaning the fiscal and caregiving burden per working adult is nearly twice as heavy as in Luxembourg, even before accounting for Italy’s older population also living longer on average.
Decade by Decade, How the Structure Has Shifted
The EU’s under-15 share fell in every single decade from 1960 to today without a single reversal, from roughly 24 percent to 14.4 percent. The 65-plus share rose in every decade over the same period, from roughly 11 percent to 22.0 percent. The working-age share is the one band that has genuinely changed direction, rising through the 1960s to the early 2000s as large youth cohorts aged into it, then falling steadily since as those same cohorts age out faster than smaller younger generations replace them.
The 2030 to 2050 Forecast
Continent-wide, Europe’s median age is projected to climb from 43.1 in 2026 to 44.2 by 2030, 46.4 by 2040, and 46.2 by 2050, a slight plateau late in the period as the oldest baby boomers begin to pass out of the population entirely. The clearest structural shift ahead is within the 65-plus band itself, the share of over-80s is expected to grow faster than the 65 to 79 band for the first time, as the large 1946 to 1964 cohort moves fully into advanced old age.
What Population Aging Means for Europe
- Employment, a shrinking working-age share puts upward pressure on wages in some sectors while creating chronic shortages in others, particularly healthcare and skilled trades
- Retirement, most EU pension systems were designed around ratios closer to 4 or 5 working adults per retiree, not the 2.6 to 3 now common across much of Southern and Central Europe
- Healthcare, demand for chronic disease management and long-term care rises sharply as the 80-plus population grows faster than any other age band
- Housing, aging populations shift housing demand toward smaller units, accessible design, and location near healthcare rather than toward family-sized homes
- Education, shrinking child cohorts are already forcing school consolidations in parts of rural Italy, Portugal, and Eastern Europe
- Consumer spending, an older population shifts national spending patterns away from goods tied to child-rearing and toward healthcare, travel, and services
Can Immigration Reverse Population Aging
Migration can slow the shift but cannot reverse it on its own at any migration level currently under serious policy discussion. Migrants tend to arrive in working age, which helps the numerator of the dependency ratio in the short term, but migrants also age, and most European destination countries see migrant fertility converge toward the national average within one to two generations.
Demographic modeling consistently shows that fully offsetting Europe’s aging trend through migration alone would require inflows several times larger than current levels, a scale that raises separate economic, social, and political questions well beyond the demographic math itself.
Frequently Asked Questions
What percentage of Europe’s population is over 65?
Across the EU, 22.0 percent of the population was aged 65 or over as of 1 January 2025, up from 19.2 percent just a decade earlier.
What percentage of Europe’s population is under 15?
14.4 percent across the EU in 2025, down from roughly 24 percent in 1960.
Which European country has the oldest population?
Among larger countries, Italy has the oldest population, with a median age of 49. Among all territories, the Holy See and Monaco have even higher median ages, though both have very small, non-representative populations.
Which European country has the youngest population?
Ireland has the youngest population among larger EU countries, with a median age of 39 and the highest share of children in the EU at 18.5 percent.
What is the old-age dependency ratio?
It measures the number of working-age people, generally 15 to 64, relative to every person aged 65 and over. The EU average was 34.5 percent in 2025, meaning about 3 working-age people for every person 65-plus.
Can migration fix Europe’s aging population?
Migration helps at the margins by adding working-age adults, but demographic research indicates it cannot fully reverse the aging trend at any politically realistic scale, since migrants also age and tend to adopt local fertility patterns over time.
Sources
- Eurostat, Population structure and ageing, and Demography of Europe 2026 edition, EU-27 data, reference date 1 January 2025.
- United Nations, Department of Economic and Social Affairs





