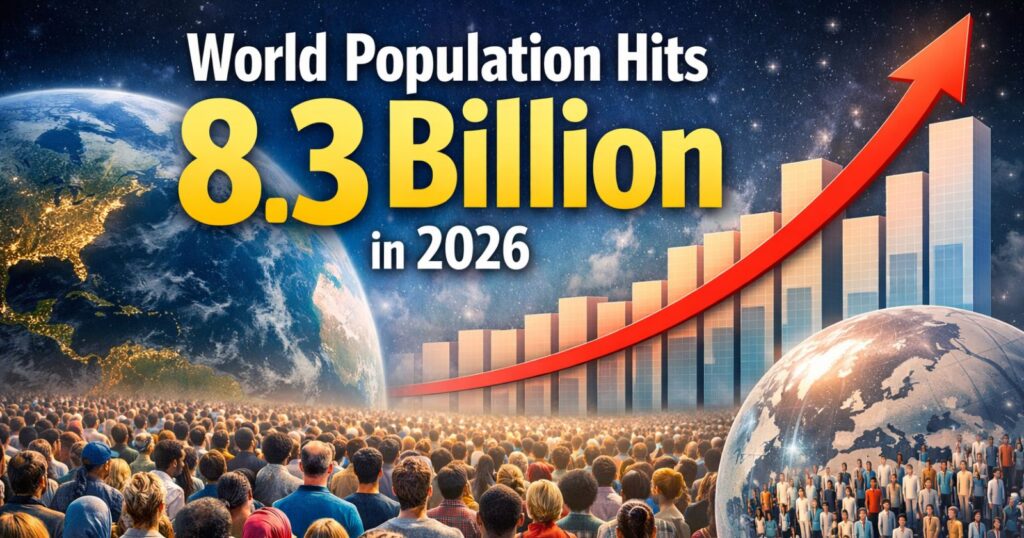
Key Fact & Findings
- No federal agency publishes projections for every US metropolitan area.
- CBO projects the population at 349 million in 2026 and 364 million in 2056, with deaths exceeding births from 2030.
- Weldon Cooper projects 363.3 million by 2040 (+6.3% from 2025), with Texas and Florida supplying 51.9% of the growth.
- Idaho (+24.1%), Utah (+21.9%) and Texas (+20.7%) lead state projections; West Virginia (-8.4%) and Illinois (-5.1%) trail.
- Thirteen states are projected to shrink between 2025 and 2040.
- Single-year arithmetic puts Dallas-Fort Worth past Chicago around 2035, an illustration and not a projection.
- International migration, which supplied 71% of metro growth in 2024 to 2025, is the main swing factor.
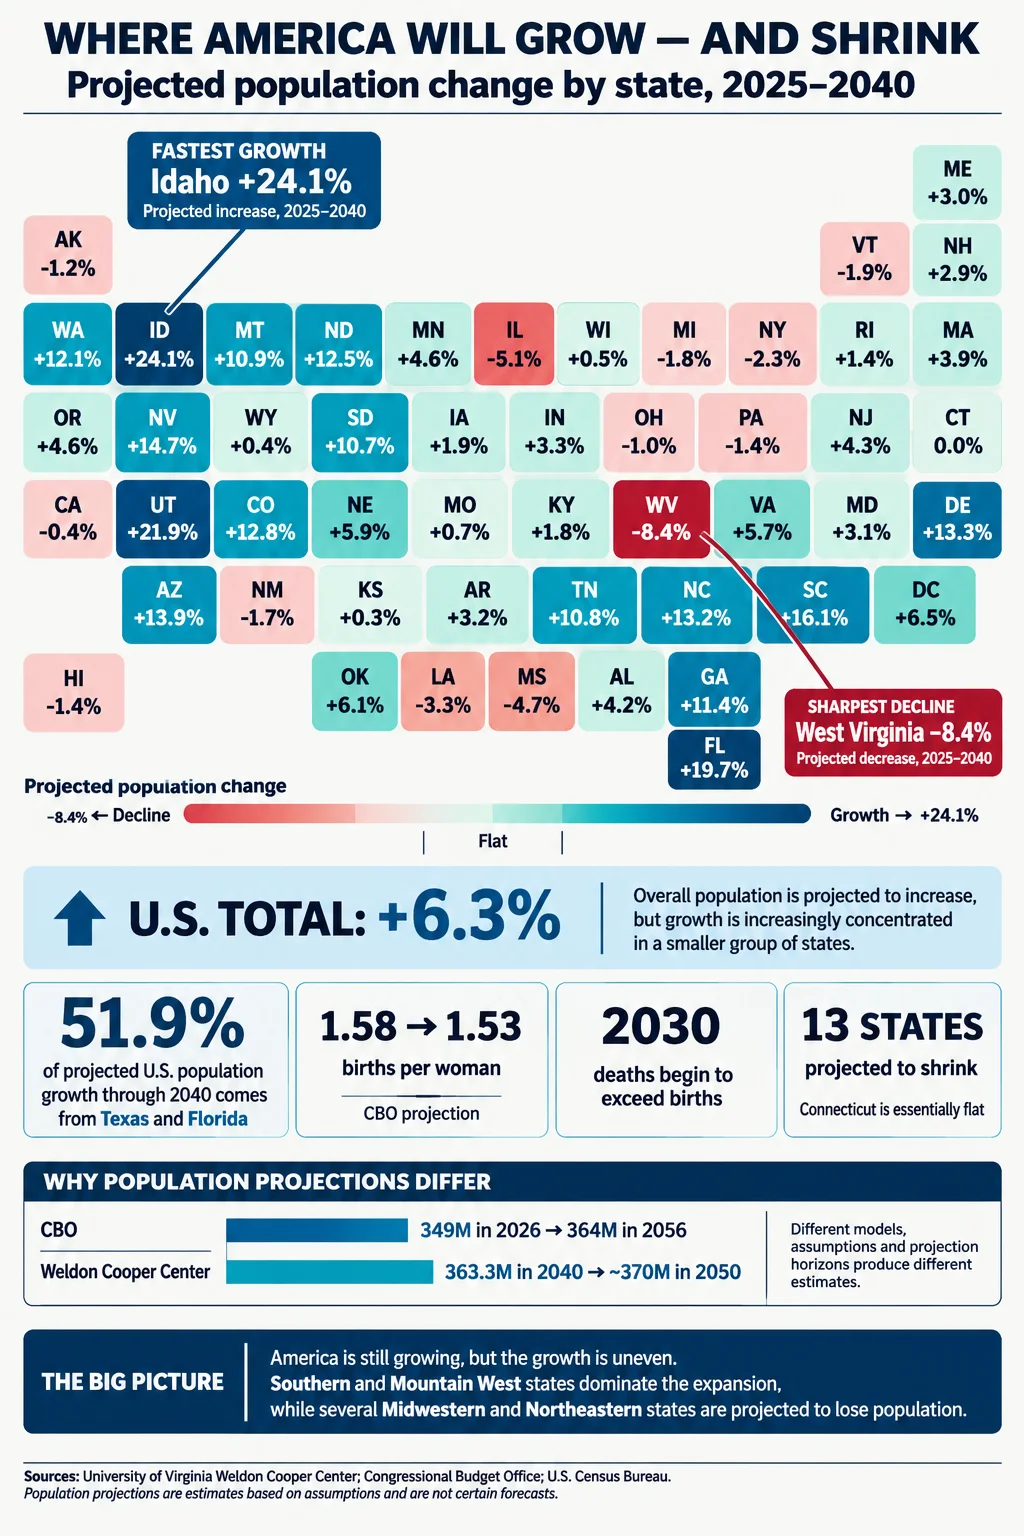
The federal government does not publish a population projection for every US metropolitan area, and any article that offers a ranked list of 2050 metro populations is either using a private model or inventing one. What does exist is a layered set of projections: national figures from the Congressional Budget Office (CBO) and the Census Bureau, and state figures from the University of Virginia’s Weldon Cooper Center for Public Service, whose July 2026 release projects Idaho growing 24.1% and West Virginia shrinking 8.4% between 2025 and 2040. Because metro areas are built from counties inside states, those state numbers say a lot about where metro growth is likely to be strong or weak.
Data Snapshot
| Metric | Figure | Source and year |
|---|---|---|
| US population, 2026 | 349 million | CBO, January 2026 |
| US population, 2056 | 364 million | CBO, January 2026 |
| US population, 2040 | 363.3 million (+21.5 million, +6.3% from 2025) | Weldon Cooper Center, July 2026 |
| US population, 2050 | about 370 million | Weldon Cooper Center, 2024 vintage |
| Fertility rate, 2026 to 2036 | 1.58 falling to 1.53 births per woman | CBO |
| Year deaths begin exceeding births | 2030 | CBO |
| Share of 2025 to 2040 US growth in Texas and Florida | 51.9% (11.2 million) | Weldon Cooper Center, July 2026 |
| States projected to be smaller in 2040 | 13 with negative figures, Connecticut flat | Weldon Cooper Center, July 2026 |
What Is Official and What Is Not
| Level | Producer | Covers metros? |
|---|---|---|
| National, to 2056 | Congressional Budget Office | No |
| National, to 2100 | Census Bureau (2023 series) | No |
| State, to 2050 | University of Virginia Weldon Cooper Center | No, but metros sit inside states |
| County and metro | State demographers and planning agencies, private firms | Some metros, with differing methods |
The Census Bureau publishes annual estimates for metro areas but not metro projections. State demographers, regional planning agencies and private firms produce metro and county projections with different boundaries and assumptions, so figures from different providers should not be mixed in one table. The table below therefore stops at the state level.
The National Frame
CBO projects the US population, measured on the Social Security area basis, rising from 349 million in 2026 to 364 million in 2056. Annual growth slows from about 0.3% over the next decade to about 0.1%, reaching zero in 2056. Fertility is projected at 1.58 births per woman in 2026 and 1.53 in 2036, holding near that level for the following 20 years, well below the replacement rate of 2.1. From 2030, deaths exceed births, so net immigration supplies all growth. The number of people 65 or older is projected to rise through 2036 at an average of 1.6% a year.
The Weldon Cooper Center projects a larger 2050 population, about 370 million, with more than 40% of residents living in the South, and a growth rate of roughly 1.8% between 2040 and 2050. The Center’s July 2026 projections for 2040 (363.3 million) come from a newer vintage than its 2050 figure, and its projections assume recent trends continue.
CBO’s concept of the population also differs from the Census Bureau’s resident count (341.8 million in July 2025), so the series cannot be compared figure by figure. The common message is slow growth and an older population, with immigration as the swing factor.
State Projections, 2025 to 2040
| State | Projected change 2025 to 2040 |
|---|---|
| Idaho | +24.1% |
| Utah | +21.9% |
| Texas | +20.7% |
| Florida | +19.7% |
| South Carolina | +16.1% |
| Nevada | +14.7% |
| Arizona | +13.9% |
| Delaware | +13.3% |
| North Carolina | +13.2% |
| Colorado | +12.8% |
| Washington | +12.1% |
| Georgia | +11.4% |
| United States overall | +6.3% |
| New York | -2.3% |
| Illinois | -5.1% |
| Michigan | -1.8% |
| Pennsylvania | -1.4% |
| California | -0.4% |
| West Virginia | -8.4% |
Thirteen states show negative projections, including California (-0.4%), Illinois (-5.1%), New York (-2.3%) and Louisiana (-3.3%), and Connecticut is flat at 0.0%. Texas and Florida alone would account for 51.9% of national growth to 2040, and the South roughly 78%. These are state totals, so growth within a state is uneven, and the fast-growing metro areas inside slow states can still grow.
What the State Numbers Imply for Large Metros
| Metro | Host state (projection 2025 to 2040) | Direction |
|---|---|---|
| Dallas-Fort Worth, Houston, Austin, San Antonio | Texas, +20.7% | Strong growth expected |
| Orlando, Tampa, Miami | Florida, +19.7% | Strong growth expected |
| Phoenix | Arizona, +13.9% | Strong |
| Charlotte | North Carolina, +13.2% (South Carolina, +16.1%) | Strong |
| Denver | Colorado, +12.8% | Strong |
| Seattle | Washington, +12.1% | Strong |
| Atlanta | Georgia, +11.4% | Above the national rate |
| Washington | DC +6.5%, Virginia +5.7%, Maryland +3.1% | Around the national rate |
| Minneapolis | Minnesota, +4.6% | Below the national rate |
| Boston | Massachusetts, +3.9% | Below the national rate |
| Philadelphia | Pennsylvania -1.4%, New Jersey +4.3%, Delaware +13.3%, Maryland +3.1% | Mixed |
| New York | New York -2.3%, New Jersey +4.3% | Mixed to flat |
| Detroit | Michigan, -1.8% | Decline expected |
| Chicago | Illinois, -5.1% (Indiana, +3.3%) | Decline expected |
| Los Angeles, San Francisco, San Diego, Riverside | California, -0.4% | Flat |
This is an inference about direction, not a metro forecast. A metro can run ahead of or behind its state, and multistate metros such as New York, Philadelphia, and Washington combine different state trends. What the table shows is why Southern and Mountain West metros are widely expected to dominate growth, and why Rust Belt and Californian metros face slower paths unless migration changes.
Crossover Arithmetic, Not a Forecast
The 2025 metro estimates give one year of change for each of the 25 largest metros. Holding that single year’s absolute change constant shows when some rankings would flip, assuming nothing else changes. That assumption is unrealistic, since 2024 to 2025 was a year of unusually low immigration, so the results should be read as sensitivity checks.
| Pair | Gap, July 2025 | Yearly difference in change | Years to cross | Approximate year |
|---|---|---|---|---|
| Dallas-Fort Worth passes Chicago | 956,966 | 100,632 | 9.5 | 2035 |
| Houston passes Chicago | 1,529,496 | 103,795 | 14.7 | 2040 |
| Phoenix passes Miami | 1,162,134 | 67,974 | 17.1 | 2042 |
| Phoenix passes Philadelphia | 1,100,180 | 43,105 | 25.5 | 2051 |
On this arithmetic, Dallas-Fort Worth would take third place around the mid-2030s, and Phoenix would not catch Philadelphia before 2050. A shift in immigration or housing supply could move any of these dates by years. Dallas-Fort Worth’s change (+123,557) was more than five times Chicago’s (+22,925), but the Chicago metro is only 1,848 residents below its 2020 level and has grown for three straight years, so the assumption of a static gap is fragile.
Migration, Aging and Fertility
International migration is the biggest uncertainty. In 2024 to 2025, net international migration fell from 8.08 to 3.70 per 1,000 residents nationwide, and for all metro areas from 8.92 to 4.11, and it supplied 1,209,432 of the 1,704,826 residents metros gained. CBO states that its projections of fertility, mortality and net immigration are highly uncertain and that small differences compound over 30 years. If immigration stays near its 2025 level, large gateway metros such as New York, Los Angeles, Boston and Miami would grow more slowly, while Sun Belt metros fed by domestic migration and natural increase would be less affected.
Aging pushes in the same direction. Counties with fewer than 50,000 residents already have natural decrease (-1.87 and -2.89 per 1,000 in the two smallest size classes), while counties of 1 million or more have natural increase (+3.42 per 1,000). Metro areas with younger populations, a profile tied to Utah, Texas and Idaho in Weldon Cooper’s age outlook, keep more natural increase. Maine is projected to have the highest median age through 2050 and Utah the lowest.
Housing and Infrastructure
The nation’s housing stock was 148.3 million units in 2025, up 1.0% (1.4 million units) in a year, with the fastest gains in Idaho (2.1%), Arizona (2.0%) and South Carolina (1.9%). Maricopa County added about 42,000 units, more than any other county. If the state projections hold, planners in Texas, Florida and the Mountain West face continued demand for water, roads and schools, while slow-growth states face the opposite problem of maintaining infrastructure with a shrinking or stable tax base. These implications are scenario-based, and no source cited here provides metro-level infrastructure projections.
How Reliable Are Projections?
Projections assume that recent patterns continue. The Weldon Cooper Center says its own projections assume recent demographic trends will continue and carry inherent uncertainty. CBO revised its 2026 projections downward for 2025 to 2035 mainly because of lower expected net immigration. Metro boundaries also change: OMB redraws them periodically, and a county added to a metro adds its population to the headline figure. The practical lesson is to cite the provider, the vintage, and the geography every time.
Conclusion
The honest 2050 picture for metro areas is a direction, not a table. Every published projection points to slow national growth, an older population, and a shift toward the South and Mountain West, and none says that the fastest-growing metros will keep their exact rates. The most fragile input is immigration, which already dropped by more than half in one year. Readers should treat any metro ranking for 2050 as only as good as its provider and its assumptions.
Frequently Asked Questions
1. What will the US population look like in 2050?
Weldon Cooper’s 2024-vintage projection is about 370 million, with more than 40% in the South. CBO projects 364 million by 2056 on a different basis, and both expect slow growth and an older population.
2. Which US metropolitan area will have the largest population in 2050?
New York is the largest metro in 2025 by a wide margin (20.1 million versus 12.8 million for Los Angeles), and no published projection used here suggests another metro will overtake it.
3. Which American metro areas are projected to grow fastest?
No official metro ranking exists. State projections point to Texas, Florida, Arizona, the Carolinas, and the Mountain West, where state growth runs from 11% to 24% through 2040.
4. Will Texas metropolitan areas keep growing through 2050?
State projections say Texas grows 20.7% from 2025 to 2040, the third fastest in the country. Dallas-Fort Worth, Houston, Austin, and San Antonio sit inside that growth, though metro results can differ from the state.
5. Which US metropolitan areas could lose population by 2050?
Projections point to slower paths in states with negative figures, including Illinois (-5.1%), Michigan (-1.8%), New York (-2.3%), and Pennsylvania (-1.4%). Whether a particular metro declines depends on its own counties.
6. How does migration affect metropolitan population projections?
Heavily. In 2024 to 2025, international migration supplied 1,209,432 of the 1,704,826 residents metro areas gained, so a different immigration assumption changes metro results more than any other factor.
7. Are 2050 population projections guaranteed?
No. They are modeled outcomes. CBO calls its projections highly uncertain, and small changes in fertility, mortality, or immigration compound over decades.
8. Does the Census Bureau publish official population projections for every US metropolitan area?
No. It publishes national projections and annual metro estimates, but not metro projections. State agencies and private firms supply metro and county projections with their own methods.
9. What is the fertility assumption behind national projections?
CBO assumes 1.58 births per woman in 2026 and 1.53 from 2036, below replacement of 2.1.
10. Why do projection sources differ?
They use different baselines, definitions of population, boundaries, and assumptions. CBO counts the Social Security area population (349 million in 2026), while the Census Bureau counts residents (341.8 million in 2025).
Sources
- Congressional Budget Office, “The Demographic Outlook: 2026 to 2056,” January 2026.
- University of Virginia Weldon Cooper Center for Public Service, National and 50-State Population Projections (2024 vintage; July 2026 release).
- University of Virginia, “UVA report: Nation’s population growth is slowing.”
- U.S. Census Bureau, “Slow Growth Impacts Nation’s Largest Counties Hardest,” press release CB26-56, March 26, 2026.
- U.S. Census Bureau, press release CB26-80 (housing stock estimates), May 14, 2026.
- Business Stats, “The 25 Largest US Metro Areas in 2025” (metro populations and 2024 to 2025 changes used in crossover arithmetic).