
Key Findings
- Ocala, Florida (+3.4%) and Myrtle Beach (+3.2%) were the fastest-growing metros in 2024 to 2025.
- Houston (+126,720) and Dallas-Fort Worth (+123,557) added the most residents, more than the next four combined.
- No metro is on both top-10 lists.
- Four Texas metros added 342,475 residents between them.
- The 10 largest-gaining metros produced 36.4% of national growth.
- Average metro growth fell from 1.1% to 0.6%, and 310 of 387 metros slowed.
- Austin, Charlotte and Houston grew fastest among the 25 largest metros.
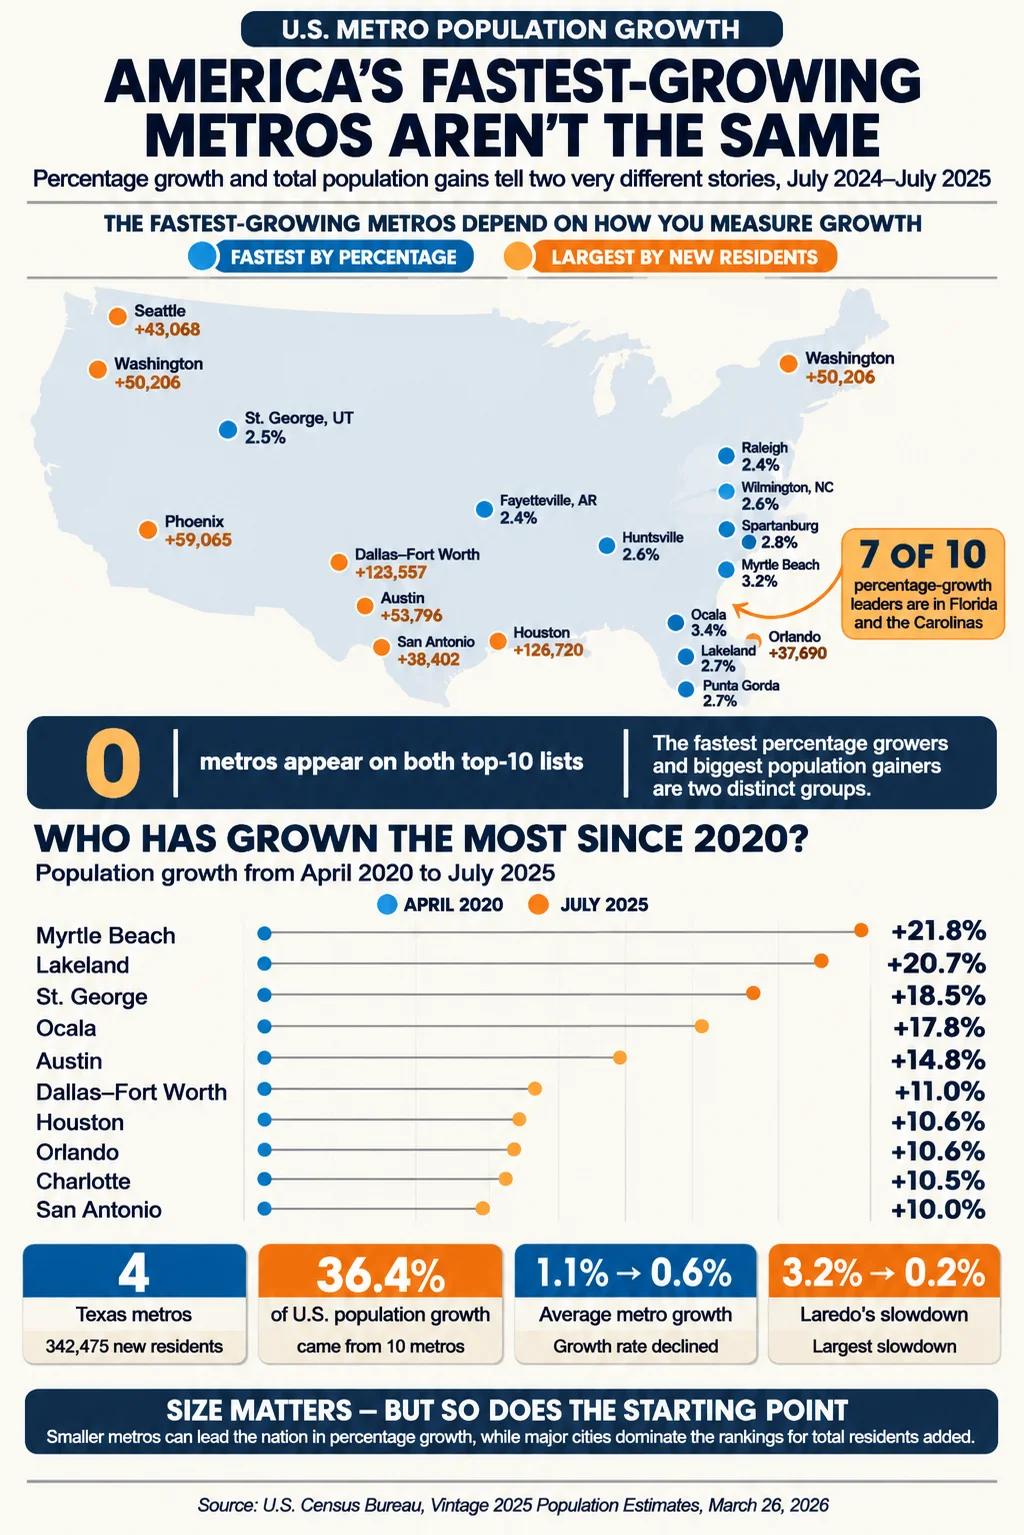
Ocala, Florida, grew 3.4% between July 2024 and July 2025, the fastest rate of any US metropolitan area, yet it added only about 14,665 people. Houston grew 1.6% and added 126,720, the most of any metro. The two top-10 lists the Census Bureau published on March 26, 2026 have no metro area in common, and the gap between them is the most useful thing to know about American regional growth right now.
The figures are Vintage 2025 estimates for July 1, 2025, using 2023 Office of Management and Budget metro boundaries. The Census Bureau’s percentage ranking only includes metro areas with at least 20,000 residents in both years. Five-year comparisons below use the April 1, 2020 estimates base in the same vintage. Comparisons are valid within one vintage only.
Data Snapshot
| Metric | Figure | Period |
|---|---|---|
| Fastest-growing metro by percentage | Ocala, FL, +3.4% | 2024 to 2025 |
| Largest numeric gain | Houston, +126,720 | 2024 to 2025 |
| Average growth, all 387 metros | +0.6% (from +1.1%) | 2024-25 vs 2023-24 |
| Metros growing more slowly than a year earlier | 310 of 387 | 2024 to 2025 |
| Share of national gain from the 10 largest-gaining metros | 36.4% | 2024 to 2025 |
| Metros on both top-10 lists | 0 | 2024 to 2025 |
| Fastest-growing large metro (more than 1 million) | Raleigh-Cary, +2.4% | 2024 to 2025 |
The 10 Fastest-Growing Metro Areas by Percentage
| Rank | Metropolitan area | April 2020 base | July 2024 | July 2025 | Growth 2024-25 | Growth since 2020 |
|---|---|---|---|---|---|---|
| 1 | Ocala, FL | 375,892 | 427,995 | 442,660 | 3.4% | +17.8% |
| 2 | Myrtle Beach-Conway-North Myrtle Beach, SC | 351,036 | 414,307 | 427,551 | 3.2% | +21.8% |
| 3 | Spartanburg, SC | 355,230 | 396,728 | 407,656 | 2.8% | +14.8% |
| 4 | Lakeland-Winter Haven, FL | 725,042 | 851,434 | 874,790 | 2.7% | +20.7% |
| 5 | Punta Gorda, FL | 186,823 | 211,456 | 217,212 | 2.7% | +16.3% |
| 6 | Huntsville, AL | 491,721 | 542,122 | 556,444 | 2.6% | +13.2% |
| 7 | Wilmington, NC | 422,602 | 480,374 | 492,772 | 2.6% | +16.6% |
| 8 | St. George, UT | 180,284 | 208,431 | 213,670 | 2.5% | +18.5% |
| 9 | Fayetteville-Springdale-Rogers, AR | 546,709 | 607,433 | 622,177 | 2.4% | +13.8% |
| 10 | Raleigh-Cary, NC | 1,413,995 | 1,558,927 | 1,595,720 | 2.4% | +12.9% |
Seven of the 10 are in Florida and the Carolinas, and nine of the 10 are in the South; St. George, Utah, is the only exception, on the Nevada and Arizona border. Raleigh-Cary is the only one with more than 1 million residents. The five-year column shows the momentum behind the single-year rate: Myrtle Beach grew almost 22% since April 2020, and Ocala and Lakeland about 18% and 21%.
The 10 Metros Adding the Most Residents
| Rank | Metropolitan area | Residents added 2024-25 | Percent | Growth since 2020 | July 2025 |
|---|---|---|---|---|---|
| 1 | Houston-Pasadena-The Woodlands, TX | 126,720 | 1.6% | +10.6% | 7,904,627 |
| 2 | Dallas-Fort Worth-Arlington, TX | 123,557 | 1.5% | +11.0% | 8,477,157 |
| 3 | Atlanta-Sandy Springs-Roswell, GA | 61,953 | 1.0% | +6.1% | 6,482,182 |
| 4 | Phoenix-Mesa-Chandler, AZ | 59,065 | 1.1% | +7.8% | 5,228,938 |
| 5 | Charlotte-Concord-Gastonia, NC-SC | 54,122 | 1.9% | +10.5% | 2,938,830 |
| 6 | Austin-Round Rock-San Marcos, TX | 53,796 | 2.1% | +14.8% | 2,620,945 |
| 7 | Washington-Arlington-Alexandria, DC-VA-MD-WV | 50,206 | 0.8% | +3.0% | 6,465,724 |
| 8 | Seattle-Tacoma-Bellevue, WA | 43,068 | 1.0% | +3.6% | 4,161,883 |
| 9 | San Antonio-New Braunfels, TX | 38,402 | 1.4% | +10.0% | 2,813,140 |
| 10 | Orlando-Kissimmee-Sanford, FL | 37,690 | 1.3% | +10.6% | 2,957,672 |
Together, the 10 added 648,579 residents, 36.4% of the nation’s one-year gain of 1,781,060 and 38.0% of the 1,704,826 gained by all metros. Four Texas metros (Houston, Dallas-Fort Worth, Austin and San Antonio) account for 342,475 of that. Eight of the 10 are in the South; Phoenix and Seattle are in the West. Percentages and five-year columns are calculated from the Census figures.
Why the Two Lists Differ
Percentage ranks reward a small base. Ocala’s 14,665 added residents would be a rounding error in Houston. Raw numbers reward size, so Houston’s 126,720 is only 1.6% growth. Few large metros lead on both measures. Among the 25 largest, the fastest rates were Austin (2.1%), Charlotte (1.9%) and Houston (1.6%), followed by Dallas-Fort Worth (1.5%), San Antonio (1.4%) and Orlando (1.3%).
What Fed the Growth
The Census Bureau divides metro growth into natural increase, net international migration (NIM), and net domestic migration. Across all 387 metros, the 2024-25 change was +1,704,826, made up of NIM (+1,209,432), natural increase (+613,743), and domestic migration (-119,205). The balance differs sharply from place to place, as the cumulative figures since April 2020 for four metros show.
| Metro | Natural change | International migration | Domestic migration | Total change since April 2020 |
|---|---|---|---|---|
| Atlanta | +118,291 | +181,339 | +74,640 | +375,366 |
| Austin | +80,728 | +103,407 | +153,121 | +337,554 |
| Baltimore | +15,450 | +47,374 | -55,245 | +8,883 |
| Boston | +42,074 | +220,820 | -170,015 | +89,502 |
Austin grew mainly because people moved there from other US counties (+153,121), Atlanta grew through a mix of births, immigration and domestic movers, and Boston and Baltimore grew only because international migration exceeded their domestic outflow. Components do not add exactly to the total because the Census Bureau leaves a small residual.
Slowdown, Border Metros and Micro Areas
Average growth for all metro areas fell from 1.1% to 0.6%, and the slowdown was steepest in places that depended on immigration. The three metros with the biggest drop in growth rate were all on the Mexican border: Laredo, Texas (from 3.2% to 0.2%), Yuma, Arizona (3.3% to 1.4%) and El Centro, California (1.2% to -0.7%).
| Area type | Growth 2023-24 | Growth 2024-25 |
|---|---|---|
| Metropolitan areas | 1.1% | 0.6% |
| Micropolitan areas | 0.5% | 0.2% |
| Outside metro and micro areas | 0.2% | 0.1% |
Micropolitan areas also have growth leaders. Jefferson, Georgia, grew 5.3% to 99,265, followed by Clewiston, Florida (2.9%), Spearfish, South Dakota (2.6%), Anderson Creek, North Carolina (2.5%) and Williston, North Dakota (2.5%).
Central City Versus Metro
A metro can grow even when its central city does not. New York City proper shrank by 12,196 residents in 2024 to 2025, yet the metro area gained 32,361. In Dallas-Fort Worth, the outer counties did the work: Collin County added 42,966 residents and Kaufman County grew 5.7% to 209,235, while Dallas County lost 2,616. The Census Bureau noted that among large metros, the fastest-growing counties tended to be on the outer edges, a pattern especially pronounced in Texas. In Charlotte, Mecklenburg County added 26,554, and the suburb of Fort Mill, South Carolina, grew 6.8%.
Will It Continue?
The Census estimates describe a slowing year, not a settled trend. If the 2025 drop in international migration persists, immigrant-fed metros will keep decelerating, while Southeastern retirement and domestic-migration metros such as Ocala and Myrtle Beach depend more on housing supply and domestic moves. Long-term outlooks for 2050 are covered in the companion article on metropolitan projections, and no figure here is a forecast.
Conclusion
Percentage growth belongs to mid-sized Southeastern metros such as Ocala, Myrtle Beach and Spartanburg, while raw additions belong to Texas and a handful of other large regions. Both lists sit inside a national slowdown that cut average metro growth nearly in half in one year. The question for the next estimates is whether international migration stays low, which would shrink the numeric leaders’ gains first, or recovers.
Frequently Asked Questions
1. What is the fastest-growing metropolitan area in America?
Ocala, Florida, at 3.4% between July 2024 and July 2025, reaching 442,660 residents.
2. Which metropolitan areas are adding the most residents?
Houston (126,720), Dallas-Fort Worth (123,557), Atlanta (61,953), Phoenix (59,065), and Charlotte (54,122).
3. Why are Southern metropolitan areas growing quickly?
Census data show a mix of domestic migration, international migration, natural increase, and new housing, with all but one of the top-10 percentage gainers in the South. The estimates measure movement, not motives.
4. What is the difference between metro growth and city growth?
Metro growth counts whole counties, so suburbs are included. New York City lost 12,196 residents while its metro area gained 32,361.
5. Which large US metropolitan areas are growing fastest?
Among the 25 largest, Austin (2.1%), Charlotte (1.9%), and Houston (1.6%). Among metros above 1 million, Raleigh-Cary led at 2.4%.
6. Does migration drive metropolitan population growth?
Net international migration contributed 1,209,432 of the 1,704,826 gained by all metros in 2024 to 2025. Domestic migration was negative overall but strongly positive in places like Austin.
7. Are suburban areas growing faster than central cities?
Often. Among large metros, the Census Bureau found the fastest-growing counties were on the outer edges, especially in Texas.
8. How are metropolitan growth rates calculated?
As the change between two July 1 estimates divided by the earlier estimate. Ocala’s growth of 14,665 on 427,995 is 3.4%.
9. Which metro slowed down the most?
Laredo, Texas, whose growth fell from 3.2% to 0.2%, followed by Yuma (3.3% to 1.4%) and El Centro (1.2% to -0.7%).
10. Which metros lost population?
Among the 25 largest, Los Angeles (-62,454), Miami (-8,909), and San Diego (-5,294).
Sources
- U.S. Census Bureau, “Slow Growth Impacts Nation’s Largest Counties Hardest,” press release CB26-56 (Tables 3, 4, 10, 11, 12 and 13), March 26, 2026.
- Business Stats, “The 25 Largest US Metro Areas in 2025” (components of change since April 2020 and top-25 growth rates).
- U.S. Census Bureau, “Population Growth Holds Steady in Midsized Cities Amid Widespread Slowdown,” press release CB26-80.
- Brookings Institution, analysis of immigration slowdown and metro growth.