Key Findings
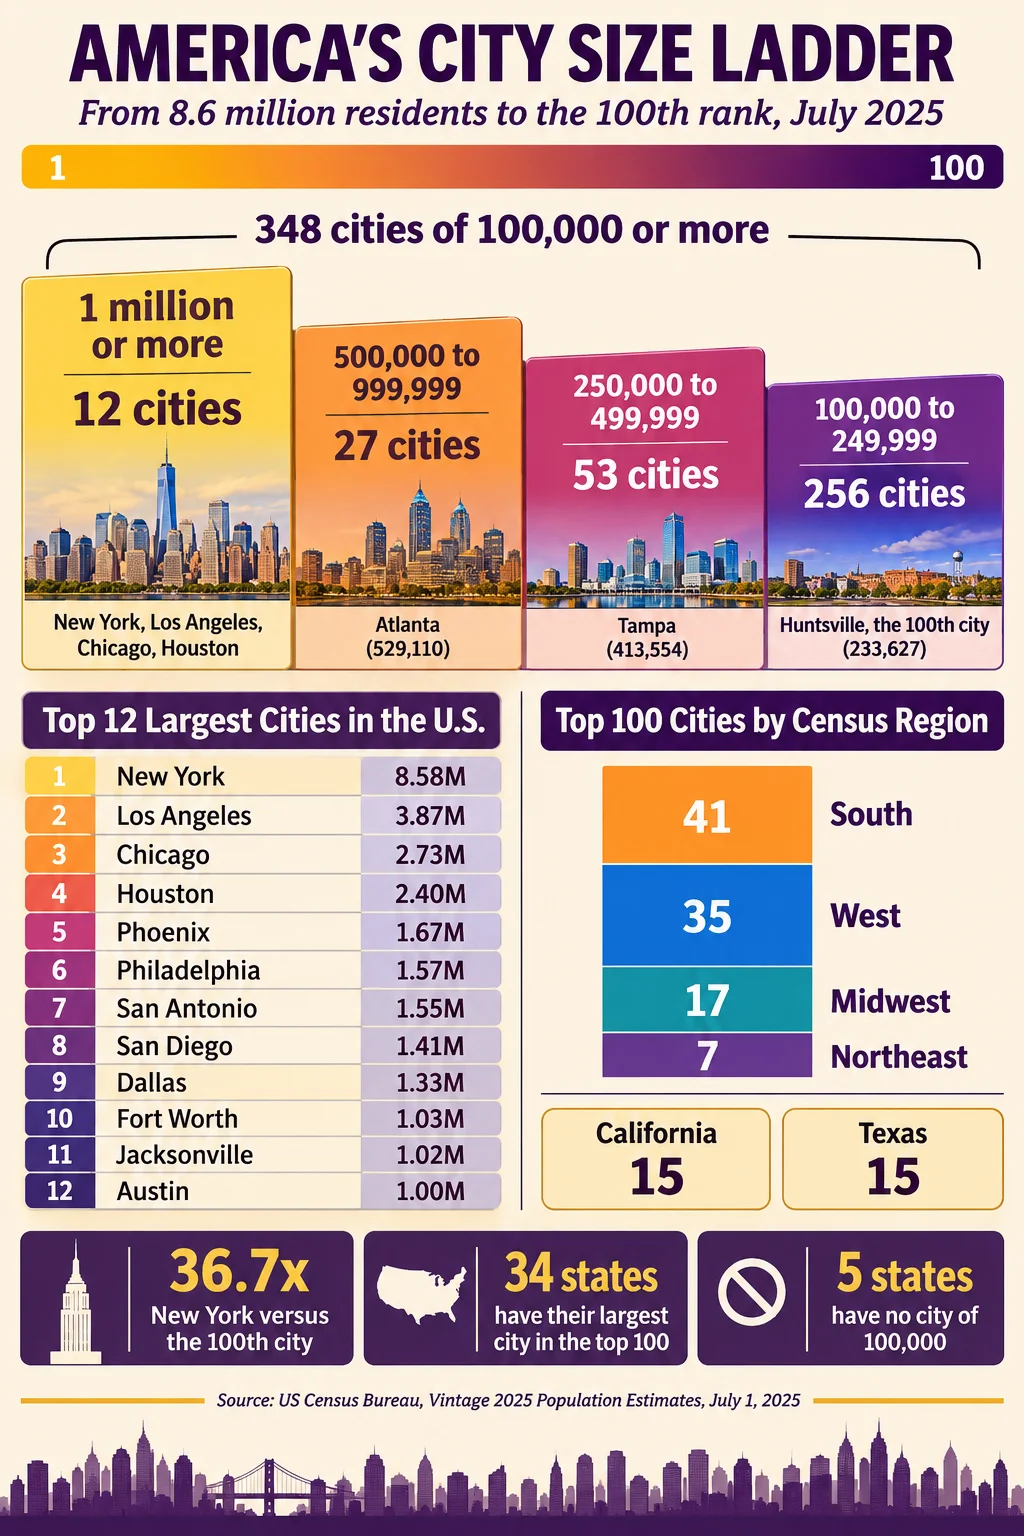
- New York City (8,584,629) remains the largest city, but lost 12,196 residents in 2024 to 2025 and 166,559 since 2020.
- Twelve cities exceed 1 million residents, and 39 exceed 500,000.
- Texas holds four of the 10 largest cities and five of the 12 largest.
- The 10 largest cities hold 26,134,516 people, 7.6% of the US population.
- Average gains in cities of 250,000 or more fell 73% in one year, from 7,699 to 2,048.
- Charlotte added the most residents in a single year (20,731); Fort Worth was second (19,512).
- On simple carry-forward arithmetic, Charlotte crosses 1 million and takes 13th place by mid-2027.
Fort Worth passed Jacksonville in the July 2025 count to become the 10th largest city in the United States, with 1,028,117 residents, while New York City lost 12,196 people in a single year, the largest numeric drop of any American city. Both facts come from the Census Bureau’s Vintage 2025 city and town estimates, released May 14, 2026, and together they set up the ranking that will carry into 2027.
No official 2027 city count exists. The next full census is in 2030, and the estimates the Census Bureau publishes for July 1, 2026 will still be estimates, not counts. The figures below are Vintage 2025 estimates for July 1, 2025, the latest completed series. Comparisons with 2020 use the April 1, 2020 estimates base inside the same vintage, which differs slightly from the original 2020 Census counts (New York City, for example, was counted at 8,804,190 in 2020 but carries a base of 8,751,188 in Vintage 2025). A short section near the end carries recent changes forward to 2027 as plain arithmetic, labeled as an illustration and not a forecast.
Data Snapshot
| Metric | Figure | Reference |
|---|---|---|
| Largest city | New York City, 8,584,629 | July 1, 2025 |
| Second largest city | Los Angeles, 3,869,089 | July 1, 2025 |
| Cities with 1 million or more residents | 12 | July 1, 2025 |
| Cities with 500,000 or more residents | 39 | July 1, 2025 |
| Combined population of the 10 largest cities | 26,134,516 (7.6% of the nation) | July 1, 2025 |
| US resident population | 341,784,857 | July 1, 2025 |
| Texas cities in the top 10 | 4 | July 1, 2025 |
| Largest one-year city gain | Charlotte, +20,731 | 2024 to 2025 |
| Largest one-year city loss | New York City, -12,196 | 2024 to 2025 |
The 25 Most Populated US Cities
All figures are Census Bureau Vintage 2025 estimates. Change is measured from the April 1, 2020 estimates base to July 1, 2025.
| Rank | City | State | April 2020 base | July 2025 | Change | Percent change |
|---|---|---|---|---|---|---|
| 1 | New York | NY | 8,751,188 | 8,584,629 | -166,559 | -1.9% |
| 2 | Los Angeles | CA | 3,896,473 | 3,869,089 | -27,384 | -0.7% |
| 3 | Chicago | IL | 2,741,640 | 2,731,585 | -10,055 | -0.4% |
| 4 | Houston | TX | 2,298,295 | 2,397,315 | +99,020 | +4.3% |
| 5 | Phoenix | AZ | 1,612,458 | 1,665,481 | +53,023 | +3.3% |
| 6 | Philadelphia | PA | 1,600,737 | 1,574,281 | -26,456 | -1.7% |
| 7 | San Antonio | TX | 1,438,310 | 1,548,422 | +110,112 | +7.7% |
| 8 | San Diego | CA | 1,382,566 | 1,406,106 | +23,540 | +1.7% |
| 9 | Dallas | TX | 1,303,503 | 1,329,491 | +25,988 | +2.0% |
| 10 | Fort Worth | TX | 923,653 | 1,028,117 | +104,464 | +11.3% |
| 11 | Jacksonville | FL | 951,880 | 1,017,689 | +65,809 | +6.9% |
| 12 | Austin | TX | 962,163 | 1,002,632 | +40,469 | +4.2% |
| 13 | San Jose | CA | 1,009,573 | 989,814 | -19,759 | -2.0% |
| 14 | Charlotte | NC | 874,907 | 964,784 | +89,877 | +10.3% |
| 15 | Columbus | OH | 906,675 | 938,396 | +31,721 | +3.5% |
| 16 | Indianapolis | IN | 887,223 | 901,116 | +13,893 | +1.6% |
| 17 | San Francisco | CA | 875,139 | 826,079 | -49,060 | -5.6% |
| 18 | Seattle | WA | 740,675 | 784,777 | +44,102 | +6.0% |
| 19 | Denver | CO | 717,680 | 740,613 | +22,933 | +3.2% |
| 20 | Nashville-Davidson | TN | 689,780 | 721,074 | +31,294 | +4.5% |
| 21 | Oklahoma City | OK | 682,938 | 719,849 | +36,911 | +5.4% |
| 22 | Washington | DC | 670,958 | 693,645 | +22,687 | +3.4% |
| 23 | El Paso | TX | 679,296 | 683,012 | +3,716 | +0.5% |
| 24 | Las Vegas | NV | 647,676 | 679,817 | +32,141 | +5.0% |
| 25 | Boston | MA | 669,665 | 672,973 | +3,308 | +0.5% |
Nineteen of the 25 cities are larger than they were at the 2020 base, and six are smaller: New York, Los Angeles, Chicago, Philadelphia, San Jose and San Francisco. The six shrinking cities lost a combined 299,273 residents. The 19 growing cities added 855,008, a net gain of 555,735 for the group. Six Texas cities (Houston, San Antonio, Dallas, Fort Worth, Austin and El Paso) account for 383,769 of those additions, or 44.9% of everything the growing cities gained.
Where the Million-Resident Line Falls
Austin crossed 1 million between 2024 and 2025, making it one of 12 US cities at or above seven digits: New York, Los Angeles, Chicago, Houston, Phoenix, Philadelphia, San Antonio, San Diego, Dallas, Fort Worth, Jacksonville and Austin. Raleigh crossed 500,000 in the same year (506,306), which lifted the number of cities at 500,000 or more to 39 nationwide. Beyond that, 348 incorporated places had at least 100,000 residents in July 2025, and five states (Delaware, Maine, Vermont, West Virginia and Wyoming) have none.
The tightest race sits just below the line. San Jose (989,814) and Charlotte (964,784) were about 25,000 residents apart, and Columbus (938,396) is another 26,000 back. Jacksonville, Austin and San Jose are separated by only 27,875 people across ranks 11 through 13.
The Top 10, Grouped by Direction
New York and Los Angeles, the Giants That Stopped Growing
New York City remains more than twice the size of Los Angeles (about 2.2 times), but the city has lost 166,559 residents, or 1.9%, since the 2020 base. Its 12,196 loss in 2024 to 2025 was the steepest numeric decline of any US city, even as the wider New York metro area gained 32,361. Los Angeles city fell by 27,384 since 2020 and posted the second largest numeric decline among cities in the latest year, while Los Angeles County lost 53,934, the largest drop of any county in the country.
Chicago and Philadelphia, Near the Flat Line
Chicago (2,731,585) is 10,055 residents below its 2020 base, a 0.4% slip that reads as stability next to its past. Philadelphia (1,574,281) is down 26,456, or 1.7%. Los Angeles still outweighs Chicago by 1,137,504 residents, about 1.42 to 1.
The Texas Four
Houston (2,397,315, up 99,020 since 2020), San Antonio (1,548,422, up 110,112), Dallas (1,329,491, up 25,988) and Fort Worth (1,028,117, up 104,464) occupy ranks 4, 7, 9 and 10. Fort Worth’s 11.3% five-year gain is the fastest of any top-10 city. In the single year to July 2025, Fort Worth added 19,512 residents (second only to Charlotte nationally), San Antonio 14,359 (third) and Houston 11,515 (sixth). Dallas city grew more slowly, and Dallas County actually lost 2,616 residents while neighboring Collin County added 42,966.
Phoenix and San Diego
Phoenix (1,665,481) added 53,023 residents since 2020 and holds fifth place comfortably, 91,200 ahead of Philadelphia. San Diego (1,406,106) grew by 23,540, though the San Diego metro area shrank by 5,294 in the latest year.
Why Big-City Growth Slowed in 2025
The Census Bureau reported that average growth fell most sharply in the largest places. Cities of 250,000 or more averaged a gain of 7,699 residents in 2023 to 2024 and only 2,048 in 2024 to 2025, a 73% drop.
| City size (2023 population) | Average gain 2023-24 | Average gain 2024-25 | Average percent 2023-24 | Average percent 2024-25 |
|---|---|---|---|---|
| Largest (250,000 and up) | 7,699 | 2,048 | 0.9% | 0.3% |
| Large (50,000 to 249,999) | 913 | 520 | 1.0% | 0.5% |
| Medium (5,000 to 49,999) | 173 | 121 | 1.0% | 0.7% |
| Small (under 5,000) | 6 | 4 | 0.3% | 0.1% |
Two forces explain most of the drop. First, net international migration, which feeds the largest cities more than any other places, fell nationwide from 8.08 to 3.70 per 1,000 residents. Second, counties with 1 million or more people lost 637,634 residents to domestic migration in the year, while counties between 50,000 and 999,999 gained 533,766.
The Census Bureau’s Matt Erickson described a “Goldilocks zone” for midsized cities, where migration and new housing kept growth steady while small towns and major hubs slowed. Charlotte, the biggest numeric gainer, was only the seventh fastest-growing city in its own metro area by percentage, behind midsized places such as Fort Mill, South Carolina (6.8%).
A 2027 Watch List, Illustrated
The table below carries each city’s most recent annual change forward two years to July 2027. It is arithmetic, not a forecast. Growth slowed sharply in 2025, immigration policy and housing supply can move quickly, and the Census Bureau revises each vintage. Austin and San Jose lack a published 2024 to 2025 change in the sources used here, so their lines use the 2020 to 2025 average annual change (about +7,708 and -3,764 a year).
| City | July 2025 | Assumed yearly change | Illustrative July 2027 | Illustrative rank |
|---|---|---|---|---|
| Fort Worth | 1,028,117 | +19,512 | 1,067,141 | 10 |
| Jacksonville | 1,017,689 | +8,319 | 1,034,327 | 11 |
| Austin | 1,002,632 | +7,708 (five-year average) | 1,018,048 | 12 |
| Charlotte | 964,784 | +20,731 | 1,006,246 | 13 |
| San Jose | 989,814 | -3,764 (five-year average) | 982,286 | 14 |
| Columbus | 938,396 | +7,696 | 953,788 | 15 |
On that arithmetic, the top 10 would not change, but Charlotte would cross 1 million and pass San Jose for 13th. New York would sit near 8.56 million, Houston near 2.42 million, and San Antonio near 1.58 million. Any real 2027 ranking depends on whether the 2025 slowdown persists.
City Population Is Not Metro Population
City rankings count residents inside municipal limits. New York City’s 8,584,629 residents are 42.7% of the 20.1 million in its metro area, while Atlanta city’s 529,110 are only about 8% of a metro of nearly 6.5 million. Jacksonville, Nashville-Davidson, and Louisville/Jefferson County are consolidated city-county governments, which is why they rank higher than their urban cores alone would suggest. Honolulu appears in Census lists as a census-designated place, not an incorporated city. These definitions explain most of the small differences between published city rankings.
Conclusion
The ranking heading into 2027 is defined less by who is largest than by who is still adding people. New York and Los Angeles keep their places on sheer scale while shedding residents, and four Texas cities have settled into the top 10 on the strength of gains that ranged from 25,988 to 110,112 since 2020. The next estimates will show whether the 2025 slowdown was a one-year pause in immigration or the start of a lower growth rate for big cities generally.
Frequently Asked Questions
1. What is the most populated city in the USA in 2027?
New York City. The latest official figure is 8,584,629 for July 1, 2025. No official 2027 count exists, and the Census Bureau’s next count is the 2030 Census.
2. What are the 10 most populated cities in the United States?
New York, Los Angeles, Chicago, Houston, Phoenix, Philadelphia, San Antonio, San Diego, Dallas, and Fort Worth, based on Vintage 2025 estimates for the incorporated city limits.
3. How many US cities have more than 1 million people?
Twelve, as of July 1, 2025. Austin joined the group between 2024 and 2025, and Jacksonville and Fort Worth sit just above the line at 1,017,689 and 1,028,117.
4. Is Los Angeles more populated than Chicago?
Yes, by a wide margin within city limits. Los Angeles has 3,869,089 residents, and Chicago has 2,731,585, a gap of 1,137,504. The Chicago metro area (9.43 million) is smaller than the Los Angeles metro area (12.84 million) as well.
5. Which state has the most cities among the biggest in the country?
Texas, with four of the top 10 and five of the top 12. California and Texas each have 15 cities in the top 100.
6. Will 2027 city populations be official Census counts?
No. The Census Bureau publishes annual estimates, not counts, between decennial censuses, and each new vintage revises earlier years.
7. Which city crossed a major threshold most recently?
Austin crossed 1 million, and Raleigh crossed 500,000, both between July 2024 and July 2025.
8. Which top-25 city lost the most people since 2020?
New York lost the most in number (166,559), and San Francisco lost the most in percentage terms (5.6%, or 49,060 residents).
9. Why do city rankings differ between websites?
Sources mix vintages, treat consolidated city-county governments differently, and sometimes count Honolulu as a place rather than a city. Original 2020 Census counts also differ from the 2020 estimates base used in later vintages.
10. Will Charlotte pass 1 million by 2027?
Carrying its 2024 to 2025 gain of 20,731 forward for two years gives about 1.006 million, but that is illustrative arithmetic. Growth slowed in 2025, so the date could slip.
Sources
- U.S. Census Bureau, “Population Growth Holds Steady in Midsized Cities Amid Widespread Slowdown,” press release CB26-80 (Vintage 2025 city and town estimates), May 14, 2026. https://www.census.gov/newsroom/press-releases/2026/vintage-2025-city-town-pop-estimates.html
- U.S. Census Bureau, “Slow Growth Impacts Nation’s Largest Counties Hardest,” press release CB26-56 (Vintage 2025 county and metro estimates), March 26, 2026. https://www.census.gov/newsroom/press-releases/2026/2025-popest-metro-micro-counties.html
- The Facts Institute, “100 Most Populous US Cities” (compilation of Census Bureau Vintage 2025 city estimates, 2020 base and 2025 values). https://factsinstitute.com/ranking/most-populous-us-cities/
- Business Stats, “The 25 Largest US Metro Areas in 2025” (metro share calculations from Census Vintage 2025). https://businesstats.com/population-of-metropolitan-areas-in-the-us/
- Miami REALTORS and RWorld Economic Insights analysis of Census Vintage 2025 city estimates (Los Angeles city decline ranking).