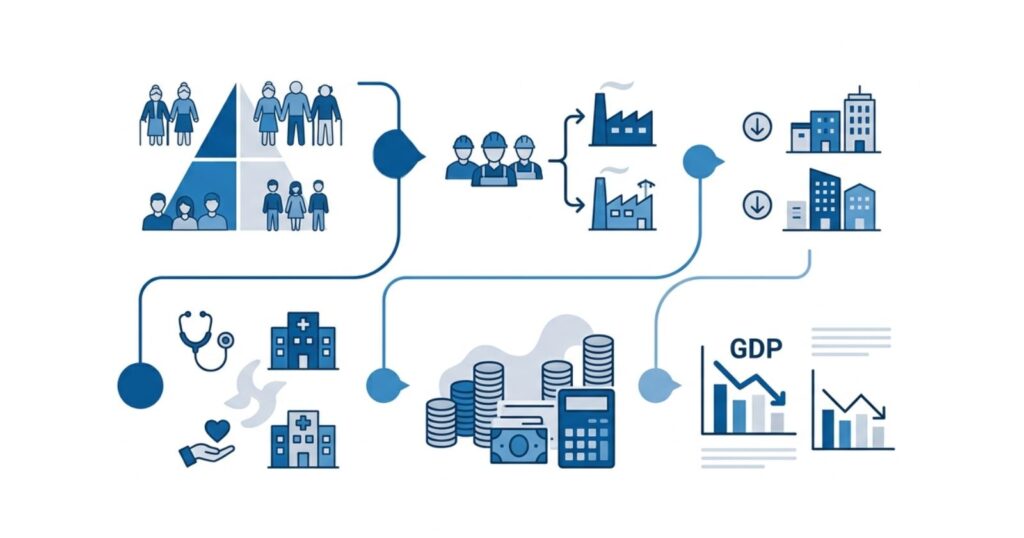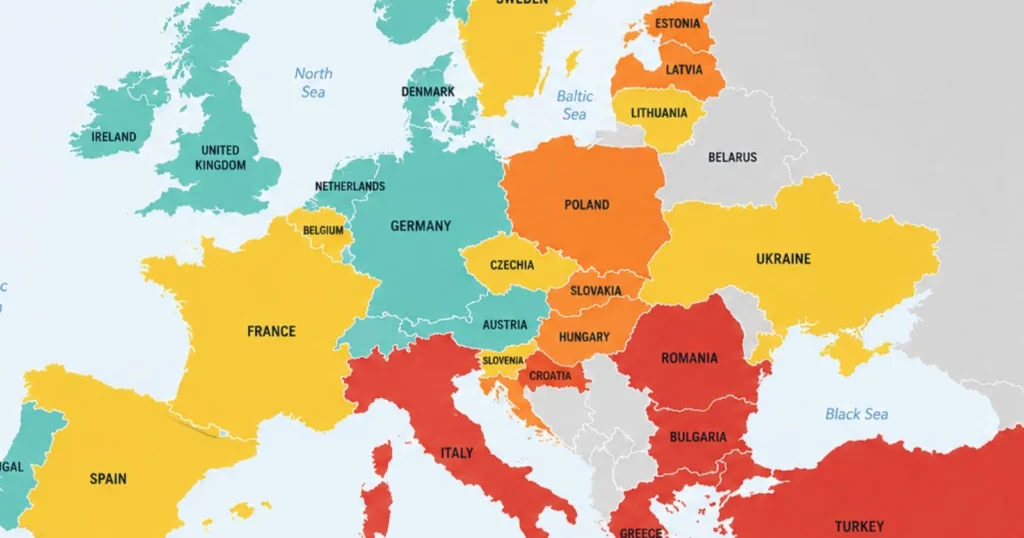

Across the 32 OECD countries that publish comparable projections, public pension spending is set to climb from 8.8% of GDP in 2023–24 to 10.0% of GDP by 2050. Public long-term care spending is projected to nearly double over the same horizon, reaching 2.8% of GDP. Public health spending is expected to rise from 5.5% to 8.8% of GDP. None of these increases are driven primarily by policy choices, they are the arithmetic consequence of populations living longer while having fewer children to replace the workers who fund those systems.
Longevity is often framed as an unambiguous social good, and in most respects it is. But every additional year of life extends the period during which a person may draw a pension, require healthcare, or need long-term care. In pay-as-you-go systems, someone still working has to fund that year. As global life expectancy climbs toward a projected 77.4 years by 2054, and as the ratio of workers to retirees keeps shrinking, the question of who actually pays for those additional years has moved from an actuarial footnote to a central fiscal challenge for governments worldwide.
Longer Lives Change the Mathematics of Public Finance
The fiscal logic is straightforward even if the politics are not. A pension system built around a retirement age of 65 and a life expectancy of 70 requires funding roughly five years of benefits per retiree. The same system, with life expectancy at 83 or 85, requires funding two to three times as many years of benefits, without any change in the contribution structure. Unless retirement ages, contribution rates, or benefit levels adjust, the gap between what a system collects and what it pays out widens automatically as life expectancy rises.
Three variables move simultaneously as populations age:
- More years spent receiving pension income, as life expectancy at retirement age continues to rise.
- More cumulative exposure to healthcare and long-term care costs, concentrated disproportionately in the final years and months of life and in the oldest age groups.
- Potentially more years of tax contribution, if employment past traditional retirement age increases, though this has so far only partly offset the other two effects.
The Pension Question
Pay-as-you-go systems
In pay-as-you-go pension systems, the dominant model in much of Europe and many other regions, current workers’ contributions directly fund current retirees’ benefits. This structure is acutely sensitive to the ratio between workers and retirees: as that ratio falls, either contribution rates must rise, benefits must fall, or the retirement age must increase to keep the system solvent.
Funded pension systems
Funded systems, in which individuals or employers accumulate savings and investment returns to finance retirement, are less directly exposed to demographic shifts in the short term, since payouts depend on accumulated capital rather than concurrent worker contributions. But funded systems are not immune to longevity risk: if retirees live longer than actuarial assumptions predicted when contribution rates were set, individual accounts can be depleted before death, shifting the cost back onto public safety nets or families.
Why longevity changes pension liabilities
The core actuarial variable is the ratio of contribution years to benefit years. The OECD’s own analysis of the old-age dependency ratio, people aged 65+ per 100 people of working age (20–64), shows the OECD average stood at 31.3 in 2022 and is projected to reach 53.8 by 2052 and 66.1 by 2082.
Cross-country variation is substantial: Japan already has the highest current ratio among OECD countries at 55.4, with Finland and Italy also above 40, while Colombia, Mexico, and Türkiye remain the youngest OECD countries by this measure, at just 14-15. South Korea is undergoing the fastest transition of any OECD country, with its ratio projected to rise from 26.3 in 2022 to 117.0 by 2082, moving it from the tenth-youngest OECD country to the oldest within roughly sixty years.
Put differently, OECD research has estimated that stabilizing the old-age dependency ratio at its 2015 level would require raising the average retirement age by 8.4 years by 2050, far beyond the roughly 1.5-year increase already legislated across OECD countries.
Healthcare and Long-Term Care Costs
Longevity does not translate one-to-one into proportionally higher healthcare costs, because a meaningful share of lifetime healthcare spending is concentrated in the period immediately preceding death regardless of the age at which death occurs, a pattern researchers call “death-related costs.” This means the healthcare cost of aging depends heavily on whether additional years of life are healthy years or years lived with disability and chronic illness, a distinction covered in depth in analyses of healthy life expectancy.
Long-term care costs are more directly tied to population aging than general healthcare costs, since the need for long-term care rises sharply with advanced age, particularly at 80 and older. OECD projections show public long-term care spending across member countries almost doubling by 2050, from current levels to 2.8% of GDP, split between a health-related component reaching 1.7% of GDP and a social-care component reaching 1.1% of GDP.
The European Commission’s 2024 Ageing Report similarly projects that total age-related public expenditure, pensions, healthcare, long-term care, and education combined, will rise from 24.4% of GDP in 2022 to 25.6% of GDP by 2070 across the EU, with health and long-term care spending among the fastest-growing components.
Projected OECD Public Spending on Aging, 2023–24 vs. 2050
| Spending Category | 2023–24 (% of GDP) | 2050 Projection (% of GDP) | Change |
|---|---|---|---|
| Public pensions | 8.8% | 10.0% | +1.2 pts |
| Public health spending | 5.5% | 8.8% | +3.3 pts |
| Public long-term care | ~1.5% (approx.) | 2.8% | Nearly doubles |
Old-Age Dependency Ratio by Country: Current and 2050 Projection
| Country | Old-Age Dependency Ratio, ~2022-23 | Projected 2050 |
|---|---|---|
| Japan | 55.4 (highest currently among OECD) | 75.3 |
| Italy | Over 40 | 62.5 |
| Finland | Over 40 | 46.4 |
| South Korea | 26.3 (2022), rising fastest of any OECD country | 71.0 |
| Spain | Not among current highest | 71.3 |
| Germany | ~37 | 59.5 |
| Poland | Not among current highest | 53.0 |
| Czech Republic | Not among current highest | 56.6 |
| France | Not among current highest | 45.9 |
| Netherlands | Not among current highest | 46.5 |
| Ireland | Not among current highest | 45.6 |
| Hungary | Not among current highest | 45.5 |
| Belgium | Not among current highest | 41.7 |
| Sweden | Not among current highest | 41.8 |
| Canada | Not among current highest | 41.2 |
| United Kingdom | ~33.6 (2023 estimate) | 40.5 |
| Denmark | Not among current highest | 40.2 |
| United States | ~30.4 (2023 estimate) | 34.3 |
| Australia | Not among current highest | 36.3 |
| Colombia / Mexico / Türkiye | 14-15 (youngest OECD countries currently) | 60-64 (rapid future aging) |
| OECD average | 31.3 (2022) | 53.8 |
Who Pays?
Financing longer lives is distributed, unevenly, across several groups:
- Workers, through payroll and income tax contributions that fund pay-as-you-go pensions and public healthcare.
- Employers, through mandatory pension contributions and, in many countries, occupational pension schemes.
- Governments, through general tax revenue used to backstop pension shortfalls, subsidize healthcare, and fund long-term care programs.
- Retirees themselves, through personal savings, funded pension drawdowns, and out-of-pocket healthcare and care costs.
- Families, through unpaid caregiving and, in many countries, direct financial support for aging relatives, a burden explored in detail in coverage of the global care economy and the sandwich generation.
- Private insurers, in systems where long-term care or supplemental health insurance plays a significant financing role.
No single model has proven immune to the fiscal pressure of rising longevity combined with falling fertility; the difference between countries lies mainly in which of these groups absorbs the largest share of the adjustment.
The Tax Base Is Changing
As populations age, the working-age population that generates most payroll and income tax revenue shrinks relative to the retired population that draws benefits. A 2026 OECD study specifically modeling the fiscal effects of population aging finds that this shift pressures tax revenue growth even as expenditure needs rise, creating a structural gap that must be closed through some combination of higher tax rates, a broader tax base, or reduced benefits.
Consumption taxes, which are paid by retirees as well as workers, have drawn increasing policy attention in aging societies as a more demographically stable revenue source than payroll taxes narrowly tied to employment income.
Can Longer Working Lives Offset Some Costs?
Extending working lives is the most direct lever available for offsetting the fiscal effect of longevity, since it simultaneously reduces the number of years a person draws a pension and increases the number of years they contribute tax revenue.
OECD research indicates that legislated increases in retirement ages across member countries, averaging about 1.5 additional years by 2050, fall well short of the roughly 8.4-year increase that would be needed to fully stabilize the old-age dependency ratio at 2015 levels.
This gap implies that without substantially higher employment rates among older adults, higher productivity growth, or increased net migration, pressure on pension systems will continue to build even after currently legislated reforms take full effect.
The Global Differences
Countries vary sharply in how exposed their public finances are to these dynamics, largely based on existing old-age dependency ratios and the generosity of pension replacement rates. Countries with older population structures and higher legislated pension benefits, several in Southern and Eastern Europe, along with Japan, face steeper projected increases in age-related spending than countries with younger populations, later effective retirement ages, or lower benefit replacement rates. Differences in whether long-term care is publicly funded, family-provided, or privately insured also produce very different fiscal exposure even among countries with similar age structures.
What Could Public Finance Look Like in 2050?
Official projections from the OECD and the European Commission’s Ageing Report converge on a consistent picture: age-related public spending will continue rising through mid-century, driven overwhelmingly by demographic change rather than policy generosity, with pensions, healthcare, and long-term care all contributing.
These are projections under current policy settings and stated demographic assumptions, not guaranteed outcomes; actual results will depend on fertility trends, migration levels, productivity growth, and the pace of further pension and retirement-age reform, all of which remain open variables rather than fixed certainties.
Conclusion
The fiscal challenge of longer lives is not a distant projection. It is already visible in the trajectory of OECD pension, health, and long-term care spending, all three of which are climbing on current policy settings well before 2050 arrives. The 8.4-year gap between the retirement-age increase needed to stabilize old-age dependency ratios and the 1.5 years actually legislated captures the scale of the unresolved mismatch.
Longevity itself is not the problem; the mismatch between how long people now live and how public finance systems were originally designed is. Closing that gap will require some combination of longer working lives, structural tax reform, and adjusted benefit design. The specific mix will differ by country, but the underlying demographic pressure will not.
Key Findings
- OECD public pension spending is projected to rise from 8.8% of GDP (2023–24) to 10.0% of GDP by 2050, with pension spending increasing in 24 of 32 OECD countries studied and falling in only 6.
- Public long-term care spending across the OECD is projected to nearly double by 2050, reaching 2.8% of GDP.
- Public health spending is projected to rise from 5.5% to 8.8% of GDP over the same period.
- Stabilizing the old-age dependency ratio at 2015 levels would require an 8.4-year increase in average retirement age by 2050, far more than the roughly 1.5 years of increase already legislated.
- The EU’s 2024 Ageing Report projects total age-related public expenditure will rise from 24.4% of GDP in 2022 to 25.6% by 2070.
- Total OECD dependency ratios (including both young and old dependents) are projected to exceed 0.90 by 2050, up from about 0.65 in 2015.
- Japan already has the highest old-age dependency ratio among OECD countries (55.4), while South Korea is aging faster than any other OECD country, with its ratio projected to rise from 26.3 in 2022 to 117.0 by 2082.
- Colombia, Mexico, and Türkiye remain the youngest OECD countries by old-age dependency ratio (14-15 currently), though all three are projected to converge toward the OECD average by 2080.
Frequently Asked Questions
1. Does longer life expectancy automatically increase pension costs?
Yes, in systems where retirement age and contribution structures remain fixed, because more years of life mean more years of pension benefit payments without a corresponding increase in years of contribution.
2. Who pays for long-term care?
Financing varies by country and typically involves some mix of public social insurance, out-of-pocket payments by individuals and families, private long-term care insurance, and unpaid family caregiving.
3. Does raising the retirement age fully solve the fiscal pressure of aging?
Not on its own. OECD research indicates the retirement-age increases legislated so far across member countries (about 1.5 years by 2050) fall well short of the roughly 8.4-year increase that would be needed to stabilize old-age dependency ratios at 2015 levels.
4. How does population aging affect tax revenue?
A shrinking working-age population relative to retirees reduces the growth of payroll and income tax revenue even as pension, healthcare, and long-term care spending needs rise, creating structural fiscal pressure documented in OECD modeling.
5. Is longer life expectancy always a fiscal problem for governments?
It creates fiscal pressure primarily where retirement systems and tax structures do not adjust alongside demographic change; longer healthy working lives and higher employment among older adults can partially offset the added cost.
6. What is the old-age dependency ratio?
It measures the number of people aged 65 and older per 100 people of working age (typically defined as 20–64), and it is the primary demographic indicator used to project pension and healthcare cost pressure.
7. How much is long-term care spending projected to grow?
OECD projections show public long-term care spending nearly doubling across member countries by 2050, reaching 2.8% of GDP on average.
8. Do funded pension systems avoid the fiscal pressure of aging?
They are less directly exposed to demographic shifts in aggregate public finances, but individual funded accounts still face longevity risk if retirees outlive their accumulated savings.
9. Which countries face the steepest pension cost increases?
Countries with older existing population structures and more generous legislated pension benefits, including several in Southern and Eastern Europe and Japan, face comparatively steep projected increases in age-related public spending.
10. What could offset rising costs from an aging population?
Higher employment rates among older workers, productivity growth, broader tax bases such as consumption taxes, and further retirement-age reform are the primary levers identified in current OECD and EU fiscal research.
Sources
- OECD, “Long-term projections of public pension expenditure,” Pensions at a Glance 2025.
- OECD, “Future long-term care expenditure trajectories across OECD countries,” 2026.
- OECD, “Dashboard for spending on long-term care.”
- OECD, “Health and long-term care,” Restoring Public Finances, 2026.
- European Commission, Ageing Report 2024 (Economic Policy Committee / DG ECFIN).
- OECD, “Old-age dependency ratio” indicator data.
- VoxEU/CEPR, “Population ageing: Pension policies alone will not prevent the decline in the relative size of the labour force.”
- United Nations, World Population Prospects 2024: Summary of Results.