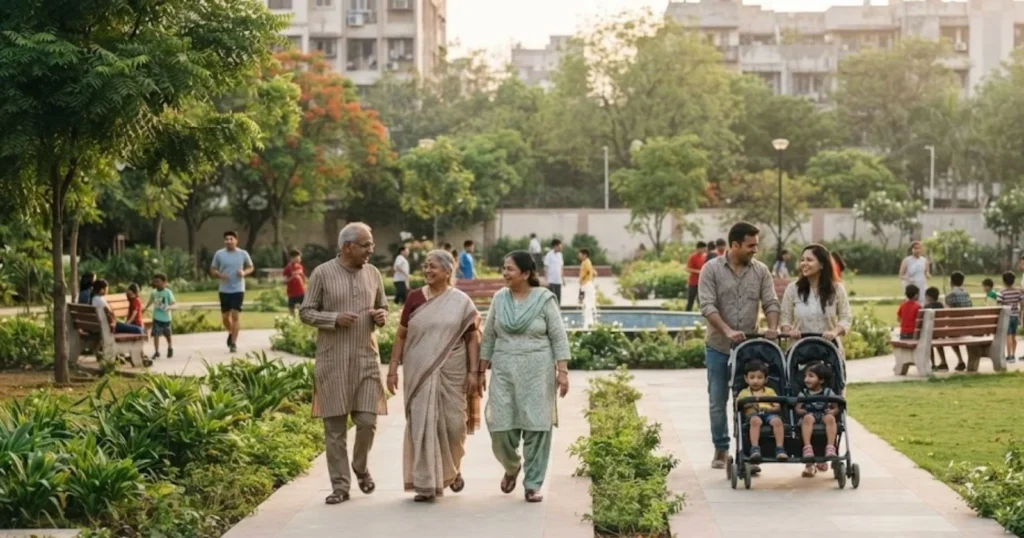
India is often described as the world’s youngest large country, and about two thirds of residents are of working age. Yet its older population is large and growing quickly. The India Ageing Report 2023 from the United Nations Population Fund (UNFPA) and the International Institute for Population Sciences (IIPS) estimated about 149 million people aged 60 and above in 2022, or roughly 10.5 percent of the population, and projected a rise to about 347 million, or 20.8 percent, by 2050. It also projected that older persons will outnumber children aged 0 to 15 around 2046.
The question of where aging happens first has three honest answers. One state has the largest elderly share, another has the largest number of elders, and a third group is aging the fastest.
How Population Aging Is Measured in India
Population aging is a rise in the share of older people relative to younger groups. India’s official convention, used by the Census, the National Policy for Senior Citizens and most government reports, defines elderly as aged 60 and above. International organizations often use 65 and above. The choice matters: using 60 plus gives a share about three to four percentage points higher than using 65 plus in most populations.
| Indicator | Definition | What it answers |
|---|---|---|
| Elderly share | Persons 60 plus as percent of total | Which states are oldest by composition |
| Absolute elderly population | Number of persons 60 plus | Where the largest service volumes are needed |
| Median age | Age that splits the population in half | Overall maturity of age structure |
| Old age dependency ratio | Persons 60 plus per 100 aged 15 to 59 | Support burden on working age adults |
| Speed of aging | Change in elderly share over a period | Which states face transition first |
| Healthy life expectancy | Years expected in good health | Quality of added longevity |
Different indicators produce different rankings. A large, young state like Uttar Pradesh ranks high in absolute numbers but low in share, while Kerala ranks high in share and lower in absolute numbers. Reference years must always be stated, since the last full census was in 2011 and later numbers are projections or survey estimates.
Which Indian States Have the Largest Elderly Populations Today?
The 2011 census recorded about 103.8 million people aged 60 and above, or about 8.6 percent of the population. The Sample Registration System (SRS) Statistical Report 2023 placed the national share at 9.7 percent, an increase of 0.7 percentage points in a single year in the survey estimate, which reflects both real aging and sampling variation.
By Share of Population
Kerala has the highest share. SRS 2023 reports roughly 15 percent of Kerala residents aged 60 and above, and the India Ageing Report projects 16.5 percent for 2021 on the Technical Group basis. Census 2011 had put Kerala at 12.6 percent, followed by Goa at 11.2 percent, Tamil Nadu at 10.4 percent, Punjab at 10.3 percent and Himachal Pradesh at 10.2 percent. The lowest shares in SRS 2023 were in Assam and Jharkhand at about 7.6 percent and Delhi at about 7.7 percent.
| State | 60 plus share, Census 2011 | 60 plus share, other recent estimate |
|---|---|---|
| Kerala | 12.6% | about 15% (SRS 2023); 16.5% (projected 2021) |
| Goa | 11.2% | not covered here |
| Tamil Nadu | 10.4% | 13.7% (projected 2021) |
| Punjab | 10.3% | 12.6% (projected 2021) |
| Himachal Pradesh | 10.2% | 13.1% (projected 2021) |
| Andhra Pradesh | about 9.8% (undivided) | 12.3% (projected 2021) |
| Assam | lower | about 7.6% (SRS 2023) |
| Jharkhand | lower | about 7.6% (SRS 2023) |
| Delhi | lower | about 7.7% (SRS 2023) |
| India | 8.6% | 9.7% (SRS 2023) |
By Absolute Numbers
Large populations produce large elderly counts. Uttar Pradesh and Maharashtra each had well over 10 million residents aged 60 and above in Census 2011, and Bihar, West Bengal, Tamil Nadu, Andhra Pradesh and Karnataka also had large counts.
As of the projections in the India Ageing Report 2023, the largest increases in the number of elderly between 2021 and 2036 are expected in the most populous states, because even a modest share rise applied to a large base produces millions of additional older residents.
The practical implication is that service planning needs both measures. Kerala needs a higher proportion of geriatric services per resident, while Uttar Pradesh needs far more total capacity, even though its elderly share is below the national mean.
Where Is Population Aging Likely to Accelerate First?
States With Established Older Age Structures
Kerala, Tamil Nadu, Himachal Pradesh, Punjab and Goa already have elderly shares above the national average. All have had low fertility for more than three decades, high life expectancy and, in several cases, large out-migration of working age adults. Kerala’s infant mortality of 5 per 1,000 and life expectancy in the high 70s in SRS reporting mean that more of each birth cohort survives into old age.
Technical Group projections for 2036 place the 60 plus share above 20 percent in Kerala and Tamil Nadu and near 19 percent in Himachal Pradesh and Andhra Pradesh. These are official projections that rest on assumptions about fertility and mortality.
States Approaching a Faster Aging Transition
Aging speed depends on the size of the cohorts now in their late forties and fifties. In states where fertility fell sharply in the 1980s and 1990s, such as Karnataka, Telangana, West Bengal, Maharashtra and Odisha, the large cohorts of earlier decades move into the 60 plus group during the 2030s. Their elderly shares are still below Kerala’s but could rise quickly.
States with high recent fertility, including Bihar, Uttar Pradesh, Jharkhand and Madhya Pradesh, will age later. Their elderly shares remain below 10 percent in most estimates through the 2020s, but the absolute numbers will still grow as the base is huge.
Why Aging Speed Is Different From Current Aging Levels
A state can be young today and age fast, or old today and age slowly. Speed is the change in elderly share across a period. For instance, Kerala moved from 12.6 percent in Census 2011 to about 15 percent in SRS 2023, roughly 2.5 points in twelve years, while the national share moved from 8.6 to 9.7, about 1.1 points. Different data sources limit exact comparison, so these are indicative.
| Category | Ranking by share | Ranking by absolute number | Ranking by speed |
|---|---|---|---|
| Leaders | Kerala, Goa, Tamil Nadu | Uttar Pradesh, Maharashtra | Kerala, Tamil Nadu, plus states in transition |
| Likely risers | Karnataka, Andhra Pradesh, Telangana, West Bengal | Bihar, West Bengal | Karnataka, Telangana, Maharashtra |
| Lagging | Bihar, Jharkhand, Assam | Smaller states | Bihar, Uttar Pradesh in 2020s |
District level aging is expected to be sharper in some places, such as coastal Kerala and parts of Himachal Pradesh, but reliable district estimates beyond Census 2011 are limited.
Why Some Indian States Are Aging Faster
Aging has four mechanical drivers, and none works alone.
Fertility decline reduces the size of younger cohorts, which raises the share of older ones. Mortality decline raises survival into old age and extends how long older people live. Migration moves younger adults away from some states, which raises the elderly share at the origin and lowers it at the destination. Past cohort size sets the timing, because large cohorts move through the age pyramid like a wave.
Kerala combines all four. Fertility has been below replacement for decades, survival is the best in India, and large numbers of working age adults have worked abroad. Punjab and Himachal Pradesh show a similar mix with out-migration of young adults to cities and overseas. Tamil Nadu’s aging reflects early fertility decline and strong health outcomes, though it also receives migrants who dampen the shift.
| Driver | Mechanism | Example |
|---|---|---|
| Fertility decline | Fewer children shrink the base of the pyramid | Kerala, Tamil Nadu |
| Mortality decline | More people reach and survive past 60 | Kerala, Himachal Pradesh |
| Out-migration of younger adults | Raises elderly share at origin | Kerala, Punjab |
| In-migration of younger adults | Lowers elderly share at destination | Delhi, Maharashtra |
| Cohort timing | Large cohorts reach 60 together | Karnataka, West Bengal in the 2030s |
How Population Aging Will Change Healthcare Demand
Older adults need more chronic disease management, primary care and long term support. The Longitudinal Ageing Study in India (LASI) Wave 1 (2017 to 2018), led by IIPS, found that roughly three in four older adults live with at least one chronic condition, with hypertension, diabetes, heart disease, arthritis and sensory impairments common. Needs differ by age band, sex, income and region, so planning should avoid treating all older adults alike.
Demographic projections show how many older adults will exist, not how much care they will use. Utilization depends on income, insurance, distance to facilities and attitudes toward care. Rural older adults often lack nearby specialists and rely on a primary health center or a sub-center, while urban older adults can reach private hospitals but face high out of pocket costs.
| Service area | Need driven by aging | Current public response |
|---|---|---|
| Chronic disease management | Hypertension, diabetes, heart disease | National Programme for Non-Communicable Diseases screening |
| Geriatric care | Specialized clinics, rehabilitation | National Programme for Health Care of the Elderly (NPHCE) |
| Insurance | Hospitalization costs | Ayushman Bharat PM-JAY extended to all residents aged 70 and above in 2024 |
| Long term care | Home and residential support | Limited public provision, mostly family based |
| Mobility and access | Transport, accessible facilities | Uneven, mostly local |
| Workforce | Geriatricians, nurses, caregivers | Shortages in most states |
Workforce training is a bottleneck. Geriatric medicine has few specialists, and trained caregivers and nurses are in short supply. Financing is the second bottleneck: public health spending is around 1.8 to 1.9 percent of GDP in recent National Health Accounts, and out of pocket payments remain a large share of total health spending.
Pensions, Retirement Income, and Household Financial Security
Most older Indians worked in informal jobs with no pension. Formal pension systems include the Employees’ Provident Fund and Employees’ Pension Scheme, government employee pensions, the National Pension System and the voluntary Atal Pension Yojana. These cover a minority. LASI found that a minority of older adults receive any pension.
Noncontributory support exists through the National Social Assistance Programme, which includes the Indira Gandhi National Old Age Pension Scheme. The central contribution has been Rs 200 per month for ages 60 to 79 and Rs 500 for 80 and above, unchanged since 2012, with states topping up at different levels. Kerala, Delhi, Tamil Nadu and several others pay more.
| Type | Examples | Coverage pattern | Adequacy issue |
|---|---|---|---|
| Contributory formal | EPFO, NPS, government pensions | Formal sector workers | Low coverage |
| Voluntary contributory | Atal Pension Yojana | Informal workers who enroll | Small payouts |
| Noncontributory social pension | NSAP, state schemes | Low income older adults | Small and unevenly indexed |
| Family support | Co-residence, transfers | Majority of older adults | Weakening with migration |
| Savings and assets | Land, housing, gold | Uneven | Illiquid |
Women are particularly exposed because many are widowed, have lower lifetime earnings and own fewer assets.
Who Will Provide Care as Families Become Smaller?
Care in India has been provided mostly by family, especially daughters in law, and mostly without pay. Household size has been falling and migration of adult children is rising. Kerala, Punjab and Himachal Pradesh have many older adults living alone or with a spouse only because children are abroad or in other cities.
That does not mean traditional arrangements are disappearing. Surveys still show most older adults living with a child or relatives. The risk is concentrated among older adults without children, widowed women, poor households and those with disabilities. Women’s unpaid care work is a hidden cost, and growing employment for women will reduce the supply of family caregivers unless formal services expand.
Paid care options include home nursing, day care centers, assisted living and residential homes. They are concentrated in cities and priced out of reach for most. The Maintenance and Welfare of Parents and Senior Citizens Act, 2007, gives legal recourse for support but is rarely a practical tool for care. Community based models in Kerala, including Kudumbashree linked home care and palliative care networks, show what is possible at lower cost.
The Regional Fiscal Challenge of Population Aging
Governments face competing demands. States with large elderly shares need healthcare, pensions, social assistance and age friendly infrastructure. States with young populations need schools, skills and job creation. Many states also carry heavy pension obligations for government employees.
| Spending area | Aging state pressure | Younger state pressure |
|---|---|---|
| Healthcare | Chronic care, hospitalization, geriatrics | Maternal and child health, primary care |
| Pensions and welfare | Employee pensions, social assistance | Smaller pension liabilities now |
| Education | Declining school enrollment | Expanding enrollment, teachers |
| Infrastructure | Accessible transport and housing | Urban expansion |
| Fiscal capacity | Higher income in some, lower revenue growth | Lower income, large needs |
Fiscal transfers under Finance Commission formulas use population, income distance, area, forest cover, demographic performance and tax effort. Population weights favor large young states, while the demographic performance criterion partly rewards states that lowered fertility. How the 16th Finance Commission (2026 to 2031) treated these weights should be checked against its report.
Demographic aging is not the only cost driver. Medical technology, price inflation and expanded insurance coverage raise health spending at any age structure, so aging should not be blamed for all cost growth.
Planning for India’s Aging States Through 2050
Planning needs to work with scenarios rather than assume demand is certain. Several priorities appear in almost every aging scenario.
Primary and preventive care should be strengthened, since detecting hypertension and diabetes early reduces later costs. Geriatric training and caregiver certification need scale. Age friendly cities require accessible transport, safer pavements and housing near services.
Rural healthcare access matters most for older adults who cannot travel. Social protection needs indexing, because a flat Rs 200 pension loses value every year. Labor policy can extend productive work and retraining for people in their sixties who want to continue. Data investment, including the 2027 census, LASI follow up rounds and district level estimates, will improve targeting.
| Priority | Lead states | Evidence status |
|---|---|---|
| Geriatric and long term care capacity | Kerala, Tamil Nadu, Himachal Pradesh | Strong need, limited supply data |
| Pension indexing and coverage | All, especially poor states | Policy debate ongoing |
| Age friendly urban design | Karnataka, Maharashtra, Tamil Nadu | Local pilots |
| Preventive care in young states | Bihar, Uttar Pradesh | Builds future health |
| District level data | All | Gap until Census 2027 |
Frequently Asked Questions
1. Which Indian state has the highest elderly population?
By share, Kerala, at about 15 percent aged 60 plus in SRS 2023. By absolute number, large states such as Uttar Pradesh and Maharashtra lead.
2. Which Indian states are aging fastest?
Kerala and Tamil Nadu have moved fastest recently, and Karnataka, Telangana, West Bengal and Maharashtra are expected to speed up in the 2030s. Speed depends on the period and indicator.
3. How large will India’s elderly population be by 2050?
The India Ageing Report 2023 projects about 347 million aged 60 plus, or 20.8 percent, under its baseline.
4. Why are some southern Indian states aging faster?
Earlier fertility decline, high survival and migration of younger adults raised the elderly share.
5. How will aging affect government spending?
It raises healthcare, pension and care demand, but price, technology and coverage changes also matter.
6. What is the old age dependency ratio? It is the number of persons aged 60 plus per 100 persons aged 15 to 59.
7. Does aging mean economic decline? No. Outcomes depend on productivity, participation, migration and policy.
8. Is 60 or 65 the right age threshold?
India uses 60 in official policy, the UN often uses 65. Both should be labeled.
9. What is healthy life expectancy?
It is the average number of years lived in good health, which is lower than total life expectancy.
10. How can migration accelerate aging?
When younger adults leave a state, the remaining population has a higher share of older residents.
Sources and Data Notes
- Census of India 2011, Age tables; Office of the Registrar General SRS Statistical Report 2023.
- UNFPA India and IIPS, India Ageing Report 2023.
- IIPS and Ministry of Health and Family Welfare, Longitudinal Ageing Study in India Wave 1.
- National Commission on Population, Technical Group projections (2020).
- Ministry of Rural Development, National Social Assistance Programme; National Health Authority, PM-JAY.
- Finance Commission of India reports.
- Data note: state shares from different sources and years are not strictly comparable. Verify against Census 2027 releases when available.