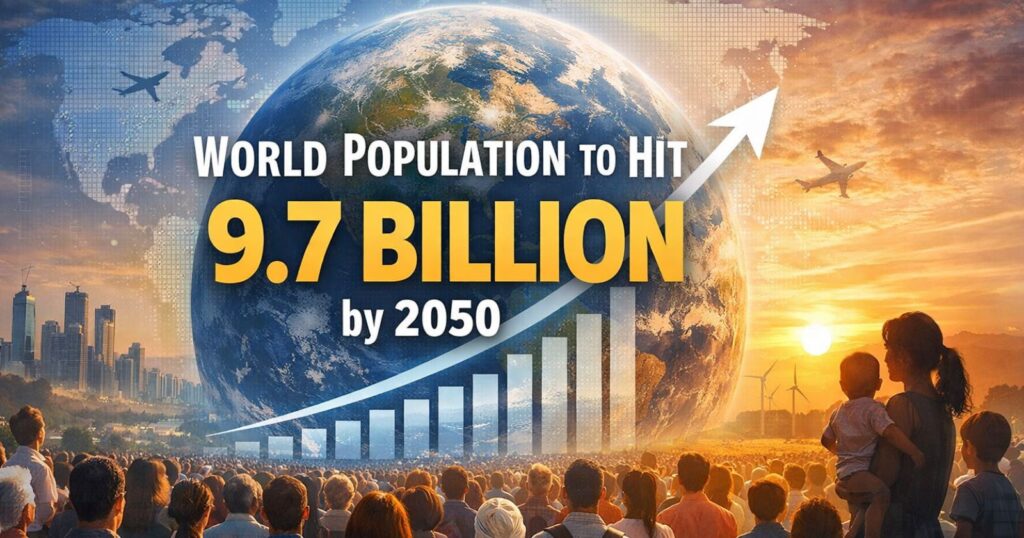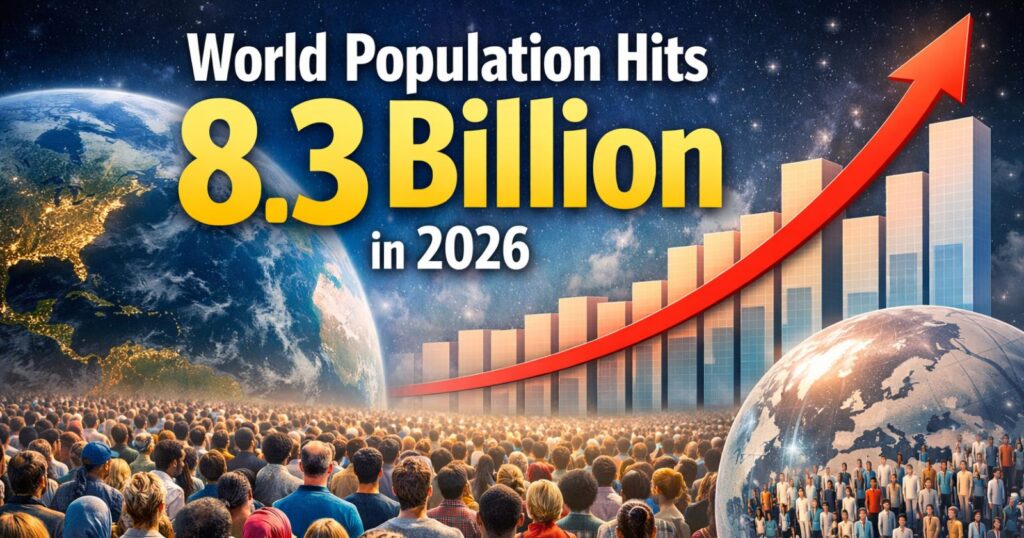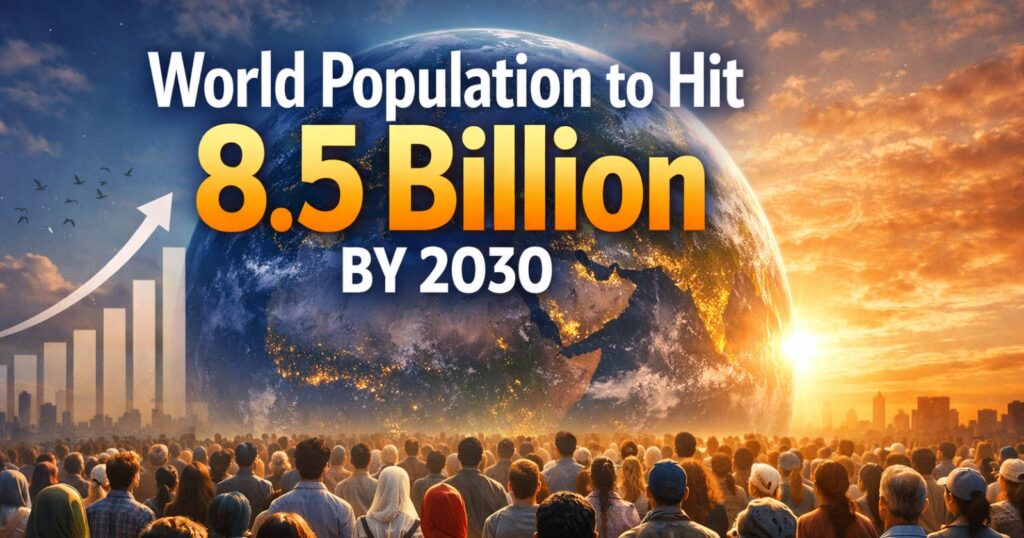
Under the most widely used birth-year boundaries, Generation Z is likely to still be the largest generation on Earth in 2050, with about 2.0 billion people aged 38 to 53, out of a projected world population of 9.7 billion. That answer holds for the United Nations medium projection and Pew Research Center’s definitions. It changes if the boundaries move by a few years, and it changes if the question shifts from total size to the number of people born in each year.
No official agency publishes population by generation, so the figures below come from a cohort calculation: ages in the UN projections are converted to birth years and summed into generational ranges. The result is an editorial estimate calibrated to the UN’s total, with a margin of several percent, and its method is set out so that it can be repeated with the UN data files.
Data Snapshot
| Indicator | Figure | Source |
|---|---|---|
| World population, 2024 | 8.2 billion | UN WPP 2024 |
| World population, 2050 (medium variant) | 9.7 billion | UN WPP 2024 |
| Projected peak population | About 10.3 billion, mid-2080s | UN WPP 2024 |
| World fertility rate | 3.31 (1990), 2.25 (2024) | UN WPP 2024 |
| Life expectancy at birth | 73.3 (2024); 77.4 (2054) | UN WPP 2024 |
| Largest generation in 2050, Pew boundaries (editorial estimate) | Generation Z, about 2.0 billion | Calculated |
What Does the Largest Generation in 2050 Mean?
“Largest” can mean three different things, and the answer differs for each:
- Total surviving population of a birth-year range in 2050.
- Share of the total population in 2050.
- Average cohort size per birth year, which removes the effect of a generation spanning more or fewer years.
Generations are also not statistical categories. A generation is a sum of single-year age groups chosen by convention. Some generations will not have finished being born by 2050, which makes any ranking provisional for them.
The Generations That Will Shape the 2050 Population
Pew’s boundaries apply through Generation Alpha, which this article ends in 2025. For later births, a provisional cohort labeled Generation Beta (2026 to 2039) is used, a label proposed by some research firms and not by Pew, followed by a residual group born from 2040 to 2050.
| Generation | Birth years | Age in 2026 | Age in 2050 |
|---|---|---|---|
| Silent | 1928 to 1945 | 81 to 98 | 105 to 122 |
| Baby Boomers | 1946 to 1964 | 62 to 80 | 86 to 104 |
| Generation X | 1965 to 1980 | 46 to 61 | 70 to 85 |
| Millennials | 1981 to 1996 | 30 to 45 | 54 to 69 |
| Generation Z | 1997 to 2012 | 14 to 29 | 38 to 53 |
| Generation Alpha | 2013 to 2025 | 0 to 13 | 25 to 37 |
| Generation Beta (provisional) | 2026 to 2039 | Not yet born | 11 to 24 |
| Born 2040 to 2050 | 2040 to 2050 | Not yet born | 0 to 10 |
How Population Projections Work
The UN uses the cohort-component method. Each cohort is aged forward one year at a time, reduced by deaths, adjusted for net migration, and joined by new births calculated from the number of women of reproductive age and assumed fertility rates.
Fertility Assumptions
Fertility affects only people not yet born, so it matters mainly for Beta and the 2040-to-2050 group. World fertility fell from 3.31 in 1990 to 2.25 in 2024, and the UN medium variant assumes continued convergence toward and below replacement in most countries. Two-thirds of the world’s people already live in countries below 2.1.
Mortality and Cohort Survival
For people already born, mortality is the main source of change. Global life expectancy is projected to rise from 73.3 years in 2024 to 77.4 in 2054. Survival from age 14 to 38 is about 96%, and from age 54 to 78 about 60% to 65%, so the older generations shrink fastest.
Migration and Geographic Population Change
Net migration across all countries sums to zero, so it cannot change the world total, but it reshapes national totals. The UN expects immigration to soften population declines in 50 countries.
Projection Scenarios and Uncertainty
The medium variant is a central path. High and low fertility variants differ by several hundred million people in 2050, almost entirely in cohorts not yet born. Cohorts already born are projected with much smaller uncertainty, typically within a few percent, because only mortality and migration can alter them.
Projected Population of Each Generation in 2050
| Generation | 2026 (billions, approx.) | 2050 (billions, approx.) | Change | Share of 2050 population |
|---|---|---|---|---|
| Silent | 0.15 | Under 0.01 | About -100% | Under 0.1% |
| Baby Boomers | 0.95 | 0.15 | -84% | 1.5% |
| Generation X | 1.50 | 1.00 | -33% | 10.3% |
| Millennials | 1.85 | 1.65 | -11% | 17.0% |
| Generation Z | 2.05 | 2.00 | -2% | 20.6% |
| Generation Alpha | 1.75 | 1.75 | About 0% | 18.0% |
| Generation Beta (provisional) | n/a | 1.75 | n/a | 18.0% |
| Born 2040 to 2050 | n/a | 1.40 | n/a | 14.4% |
| Total | About 8.3 | 9.7 | About +17% | 100% |
Figures are editorial estimates calibrated to the UN’s 9.7 billion total for 2050 and rounded to 0.05 billion. The 2026 column excludes people born during 2026, which explains why the groups sum to slightly under 8.3 billion.
Which Generation Could Have the Largest Population in 2050?
On total size, the ranking is Generation Z (2.0 billion), then Alpha and Beta (about 1.75 billion each), Millennials (1.65 billion) and the 2040-to-2050 group (1.4 billion). Gen Z holds a lead of roughly 250 million over Alpha, about 14%, which exceeds the likely margin of error for cohorts already born.
The ordering is sensitive to definitions. On average cohort size per birth year, the ranking reverses:
| Generation | Birth years in range | Average per birth year, 2050 (millions) |
|---|---|---|
| Generation Alpha | 13 | 135 |
| Generation Z | 16 | 125 |
| Generation Beta (provisional) | 14 | 125 |
| Millennials | 16 | 103 |
| Generation X | 16 | 63 |
Alpha is the largest per birth year because annual births stayed near 130 to 140 million after 2012 while earlier cohorts had higher mortality. Its lower total comes from covering 13 years instead of 16. A framework with a 15-year Alpha (2010 to 2024) and a 15-year Gen Z (1995 to 2009), as some research firms use, would give Alpha roughly 2.0 billion against 1.9 billion for Gen Z in 2050, so the winner would flip. A claim about the “largest generation” is therefore valid only with the boundaries stated.
How Country-Level Population Trends Could Change the Outcome
Countries With Aging Populations
In Japan, the National Institute of Population and Social Security Research projects that people aged 65 and over will be about 37% of the population in 2050, with the total falling to about 105 million. South Korea projects about 40% aged 65 and over in 2050. In such countries older generations still make up the largest slice and the youngest cohorts are small.
Countries With Younger Populations
Nigeria is projected by the UN to reach roughly 375 million by 2050 and become the world’s third most populous country. India’s population is expected to peak in the early 2060s near 1.7 billion. In these countries Alpha, Beta and later cohorts account for most of the population in 2050, and Gen Z and Millennials remain a smaller share than at present.
Countries With High Immigration
Canada, Australia and several Gulf states depend on migration for working-age growth. Because migrants arrive mostly between 20 and 40, their effect is concentrated in Gen Z, Alpha and Millennials. China, by contrast, is projected to lose about 200 million people between 2024 and 2054, about 14%.
Generation Alpha and the Future Population Balance
Alpha’s birth window (2013 to 2025) contains roughly 1.75 billion births. By 2050 survival from birth to 25 to 37 is above 95%, helped by under-five mortality of 37 per 1,000 in 2023. The cohort will be 25 to 37 in 2050, which makes it the main young-adult workforce group. If fertility falls faster than the UN medium path, it affects Beta and later cohorts, not Alpha.
Will Millennials and Gen Z Remain the Largest Adult Cohorts?
In 2050, adults aged 25 and over are mostly Gen Z (38 to 53), Alpha (25 to 37) and Millennials (54 to 69), at about 2.0, 1.75 and 1.65 billion. Millennials will have lost about 11% of their 2026 size, mainly to deaths in their sixties, while Gen Z will have lost about 2%. Generation X (70 to 85) will be down by a third to about 1.0 billion. A boundary change of two years alters the ranking, but not the pattern that today’s young adults remain the center of the adult population.
What Could Change the Generational Population Forecast?
| Cohort group | Main uncertainty | Size of uncertainty |
|---|---|---|
| Boomers, Gen X, Millennials | Old-age mortality | Small to moderate |
| Gen Z, Alpha | Child and adult mortality, migration | Small |
| Beta (2026 to 2039) | Fertility in coming years | Moderate |
| Born 2040 to 2050 | Fertility, not yet born | Large |
The UN’s 2024 revision lowered the projected peak and brought it earlier, partly because of lower fertility in China. Revisions are routine, and every edition of the World Population Prospects adjusts both the estimates for past years and the projections.
What a Larger Generation Means for the Future
Cohort size is a measure of potential demand and supply, not actual participation. A large Gen Z in 2050 means a large group in its prime working years, which matters for labor supply and tax revenue if jobs and skills match. A shrinking Gen X, aged 70 to 85, will mean heavy demand for healthcare and long-term care even as the cohort falls by a third. Pension systems will face a group at retirement age in 2050 that is about 1.65 billion Millennials entering their sixties, and housing demand will track the 2050 household formation of Alpha and Beta.
The Limits of Generational Population Projections
Generation labels are conventions, projections are conditional on assumptions, and the calculation here uses rounded global totals, not single-year national data. Anyone repeating it should download the UN’s single-age medium-variant file for 2050, convert each age to a birth year, and sum by range. Differences of 5% to 10% from the figures above are plausible and would not change the broad pattern.
Conclusion
The calculation points to a stable adult core in 2050, with Gen Z at about 2.0 billion and Alpha at about 1.75 billion, while Boomers have nearly gone and Gen X has lost a third. The sharper finding is that the “largest generation” label depends on window length: Alpha has the largest cohort per birth year, and a 15-year definition would reverse the ordering. For people already born, the numbers are reliable to within a few percent. For everyone born after 2040, they are not.
Key Findings
- Under Pew boundaries, Generation Z is projected to remain the largest generation in 2050, at about 2.0 billion people (20.6% of 9.7 billion).
- Alpha has the biggest average cohort per birth year (about 135 million), so a wider or narrower generation window can flip the ranking.
- An editorial estimate puts Boomers down 84% by 2050 (0.95 to 0.15 billion) and Gen X down 33% (1.5 to 1.0 billion).
- World population grows about 17% from 2026 to 2050 (about 8.3 to 9.7 billion), but Alpha and Gen Z stay roughly flat.
- Uncertainty is small for people already born and large for those born after 2040.
Frequently Asked Questions
1. Which generation will be the largest in 2050?
Generation Z, at about 2.0 billion, under Pew boundaries and the UN medium projection. Alternative boundaries can make Alpha larger.
2. How many people will be alive in 2050?
The UN medium variant projects 9.7 billion, rising to a peak near 10.3 billion in the mid-2080s.
3. Will Generation Alpha be the largest generation?
Not on total size under Pew boundaries (about 1.75 billion), but it has the largest average cohort per birth year, about 135 million.
4. Will Gen Z outnumber millennials in 2050?
Yes, by roughly 350 million (2.0 billion against 1.65 billion), because Gen Z has more birth years and larger annual cohorts and lower mortality at ages 38 to 53.
5. How accurate are population projections for 2050?
Reliable for people already born, with typical error of a few percent. Less reliable for those not yet born, since fertility assumptions drive their numbers.
6. Will the largest generation differ by country?
Yes. Alpha leads in Nigeria and Gen Z in India, while Gen X leads in places such as China and South Korea today, and 2050 rankings shift as older cohorts shrink.
7. Can future generations change the 2050 ranking?
Yes. Beta (2026 to 2039) is projected near 1.75 billion, similar to Alpha, and fertility changes would shift it.
8. How is population by generation calculated?
By converting ages in UN or census tables into birth years and summing the birth years in each generation’s range.
9. How many baby boomers will be alive in 2050?
An editorial estimate of about 0.15 billion, aged 86 to 104, down about 84% from 2026.
10. Does the UN publish population by generation?
No. It publishes population by age and sex, and generation totals must be calculated from those.
Sources
- United Nations Population Division, World Population Prospects 2024, key messages and data files.
- Institut national d’etudes demographiques (INED), summary of World Population Prospects 2024.
- Pew Research Center, generation definitions. https://www.pewresearch.org
- National Institute of Population and Social Security Research, Japan, population projections. https://www.ipss.go.jp
- Statistics Korea, population projections. https://kostat.go.kr
- UN Inter-agency Group for Child Mortality Estimation. https://childmortality.org