Global freshwater use has climbed roughly sixfold to sevenfold over the course of the 20th century, from under 500 cubic kilometers per year around 1900 to more than 4,000 cubic kilometers by 2000, and it has continued rising by roughly 1% annually since the 1980s. Renewable water availability per person, meanwhile, has fallen by about 7% over just the past decade, from around 5,719 to 5,326 cubic meters per person, according to the FAO’s 2025 AQUASTAT snapshot. Population growth is one driver of that squeeze, but it is far from the only one.
Is Population Growth the Main Reason Water Demand Is Rising
UN Water attributes rising global water use to a combination of population growth, socioeconomic development, and changing consumption patterns rather than population growth in isolation. A wealthier, more urbanized population generally uses substantially more water per person than a poorer, more rural one, both directly through household consumption and indirectly through the water embedded in food, energy, and manufactured goods it consumes, meaning income growth and urbanization can drive water demand up even in countries with slowing population growth.
How Much Water Does the World Use
Water withdrawal refers to water removed from its source for use, while water consumption refers to the portion that is not returned to the source, having been evaporated, incorporated into products, or otherwise lost to immediate reuse.
Renewable water resources refer to the amount of freshwater replenished annually through precipitation feeding rivers and aquifers. Global freshwater withdrawals have grown dramatically since the mid-20th century, driven by expanding irrigation and industrialization, though the rate of growth has slowed since around 2000 as many water-intensive economies approach infrastructure and resource limits.
| Sector | Share of Global Freshwater Withdrawals |
|---|---|
| Agriculture (mainly irrigation) | ~70-72% |
| Industry | ~15-20% |
| Domestic / municipal | ~12-15% |
Figures reflect UN Water and FAO AQUASTAT estimates; regional shares vary substantially, with some low-income countries allocating 90-95% of withdrawals to agriculture.
Agriculture Is the Biggest Part of the Water Equation
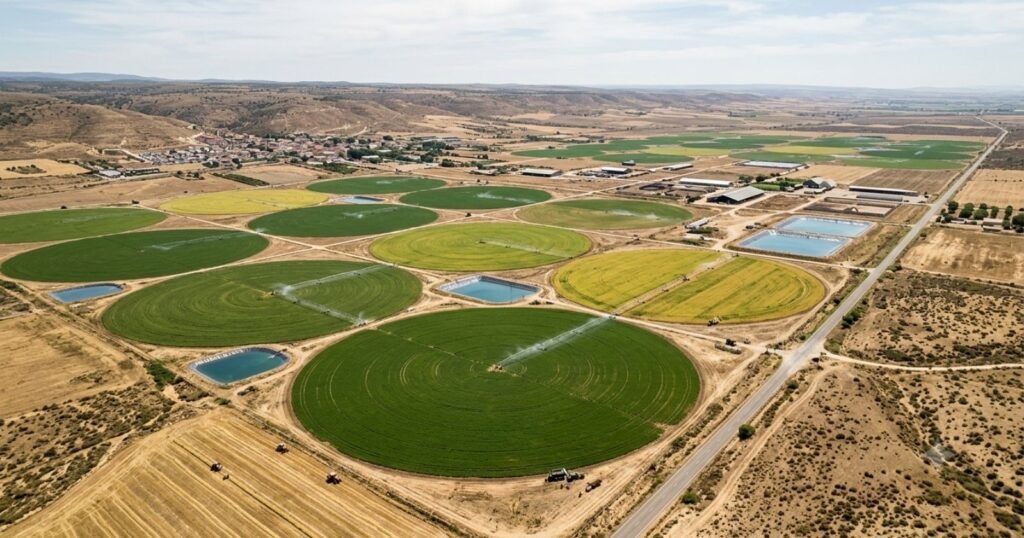
Agriculture, overwhelmingly through irrigation, accounts for roughly 70-72% of global freshwater withdrawals, making it by far the largest single driver of water demand worldwide. Sixty-six countries allocate more than 75% of their total freshwater withdrawal to agriculture, and in Afghanistan, Laos, Mali, Nepal, Somalia, and Sudan the figure reaches 95%, according to FAO’s 2025 AQUASTAT data. Because food demand itself is projected to keep rising through mid-century, driven by both population growth and rising incomes, agricultural water demand is one of the primary pressure points linking population growth to future water stress.
Growing Cities Are Changing Domestic Water Demand
Municipal water demand has grown disproportionately relative to other sectors in recent decades as populations urbanize and water supply and sanitation infrastructure expands to serve them, according to UN Water reporting. Household water consumption varies enormously by region and income level, from roughly 70 liters per person per day in some rural low-income settings to well over 140 liters per person per day in some wealthier or more water-intensive economies, reflecting differences in plumbing infrastructure, appliance use, and consumption habits rather than population size alone.
Industry and Energy Also Need Water
Manufacturing, power generation (particularly cooling for thermal power plants), and other industrial processes account for roughly 15-20% of global freshwater withdrawals, a share that tends to rise as economies industrialize and grow wealthier. This creates an indirect but significant link between energy demand growth, discussed separately in relation to population, and water demand, since most forms of thermal power generation require substantial water for cooling.
Where Is Water Demand Growing Fastest
Regions combining population growth with rising incomes and urbanization, including parts of South Asia, Sub-Saharan Africa, and the Middle East, are seeing the fastest growth in water demand. North Africa illustrates the pressure vividly: freshwater withdrawals in the region rose by roughly 16% over the past decade even as per-person freshwater availability, already among the lowest in the world, continued to decline, according to FAO’s AQUASTAT reporting.
Population Density Does Not Automatically Mean Water Scarcity
Water stress depends far more on the balance between renewable water availability and demand than on population density alone. Regions such as Northern Africa, Southern Asia, and Western Asia have the lowest renewable freshwater resources per capita in the world, with Kuwait, the United Arab Emirates, Qatar, and Yemen ranking among the countries with the lowest total renewable water, reflecting arid climate conditions as much as population pressure. By contrast, some densely populated regions with abundant rainfall and well-managed infrastructure face comparatively lower water stress than sparsely populated but arid regions.
| Factor | Effect on Water Stress |
|---|---|
| Climate (rainfall, aridity) | Major determinant of renewable water availability |
| Population density | Contributes to demand but not solely determinative |
| Infrastructure and governance | Shapes how efficiently available water is used and distributed |
| Agricultural water efficiency | Major lever given agriculture’s dominant share of withdrawals |
| Trade in “virtual water” (food imports) | Can offset domestic water scarcity |
Climate Change Complicates the Population and Water Equation
Climate change is altering precipitation patterns, increasing the frequency and severity of droughts in some regions, and accelerating glacial melt that threatens the long-term water supply for river systems that depend on seasonal snowpack and glacier melt. These effects interact with population and economic growth in ways that are difficult to disentangle cleanly, since a growing population in a region experiencing more frequent drought faces compounding pressure that neither factor alone would produce.
Can Technology Reduce Water Demand
Drip irrigation, wastewater reuse, desalination, leakage reduction in municipal water systems, and more water-efficient industrial processes all offer meaningful ways to reduce water demand growth relative to population and economic growth.
Given that surface irrigation can waste an estimated 30-50% of water applied through inefficient application, while drip irrigation can cut water use by a similar margin in some vegetable crops, efficiency improvements in agriculture represent one of the largest available levers given the sector’s dominant share of global withdrawals.
What Will Global Water Demand Look Like by 2050
Various projections estimate global water demand could rise by roughly 20-30% by 2050, driven jointly by population growth, economic development, and rising food demand, which itself requires a significant expansion in agricultural water use absent major efficiency gains. UN Water’s own assessment describes the trajectory as one of continued, if somewhat slower, growth in the demand for freshwater, concentrated disproportionately in regions that are already water-stressed.
Key Findings
- Global water use has been rising at roughly 1% per year since the 1980s, driven jointly by population growth, economic development, and changing consumption patterns.
- Agriculture accounts for roughly 70-72% of global freshwater withdrawals, making it the dominant driver of water demand worldwide.
- Renewable water availability per person fell by roughly 7% over the past decade, from about 5,719 to 5,326 cubic meters per person, according to FAO’s 2025 AQUASTAT snapshot.
- North Africa saw freshwater withdrawals rise roughly 16% over the past decade even as per-person water availability, already among the world’s lowest, continued to decline.
- Global water demand is projected to rise roughly 20-30% by 2050 under various scenarios, driven by population growth, income growth, and rising food demand.
- Water stress depends more on the balance between climate-driven water availability and demand than on population density alone; Gulf states with small populations rank among the most water-stressed in the world.
Frequently Asked Questions
1. Does population growth cause water scarcity?
Population growth contributes to rising water demand, but UN Water attributes the trend jointly to population growth, economic development, and changing consumption patterns, meaning income growth and urbanization often matter as much as headcount.
2. How much water does the world use?
Global freshwater withdrawals have grown roughly sixfold to sevenfold over the 20th century and continue rising by roughly 1% annually, though precise global totals vary by measurement methodology.
3. Which sector uses the most water?
Agriculture, primarily through irrigation, accounts for roughly 70-72% of global freshwater withdrawals, far more than industry (15-20%) or domestic use (12-15%).
4. Which countries face the greatest water stress?
Countries in Northern Africa, Southern Asia, and Western Asia, including Kuwait, the United Arab Emirates, Qatar, and Yemen, have among the lowest renewable freshwater resources per person in the world.
5. Will water demand keep increasing?
Most projections estimate global water demand will keep rising, by roughly 20-30% by 2050 under various scenarios, driven by population growth, rising incomes, and increasing food demand.
6. Can technology solve water scarcity?
Technologies including drip irrigation, wastewater reuse, desalination, and leakage reduction can meaningfully slow water demand growth, particularly in agriculture, though they require significant investment and are not a complete substitute for reducing demand growth.
7. What is the difference between water withdrawal and water consumption?
Withdrawal refers to water removed from its source for use; consumption refers to the portion not returned to the source, having been evaporated, incorporated into products, or otherwise lost to immediate reuse.
8. How much has freshwater availability per person declined?
Renewable water availability per person fell by roughly 7% over the past decade, from about 5,719 to 5,326 cubic meters per person, according to the FAO’s 2025 AQUASTAT Water Data Snapshot.
9. Does population density directly cause water scarcity?
Not directly; water stress depends more on the balance between climate-driven water availability and total demand than population density alone, which is why some sparsely populated arid regions face severe water stress while some densely populated, higher-rainfall regions do not.
10. Which region has seen the fastest recent rise in water withdrawals?
North Africa saw freshwater withdrawals rise by roughly 16% over the past decade, even as per-person water availability, already among the lowest in the world, continued to fall.
Sources
- UN Water / UNESCO, World Water Development Report statistics (unesco.org)
- Food and Agriculture Organization, 2025 AQUASTAT Water Data Snapshot, reported via UN News (news.un.org)
- United Nations in Türkiye, “The World Faces Growing Thirst” (turkiye.un.org)
- United Nations, World Population Prospects 2024 (population.un.org)