Nearly one in three Australians lives in New South Wales, yet the state that grew fastest over the past year isn’t NSW at all. It’s Western Australia, expanding at 2.17% annually, almost double the national rate, on the back of a resources boom pulling in migrants faster than any other jurisdiction in the country. Australia’s population geography is really eight very different growth stories running in parallel, not one national trend repeated eight times.
Australia’s Population at a Glance
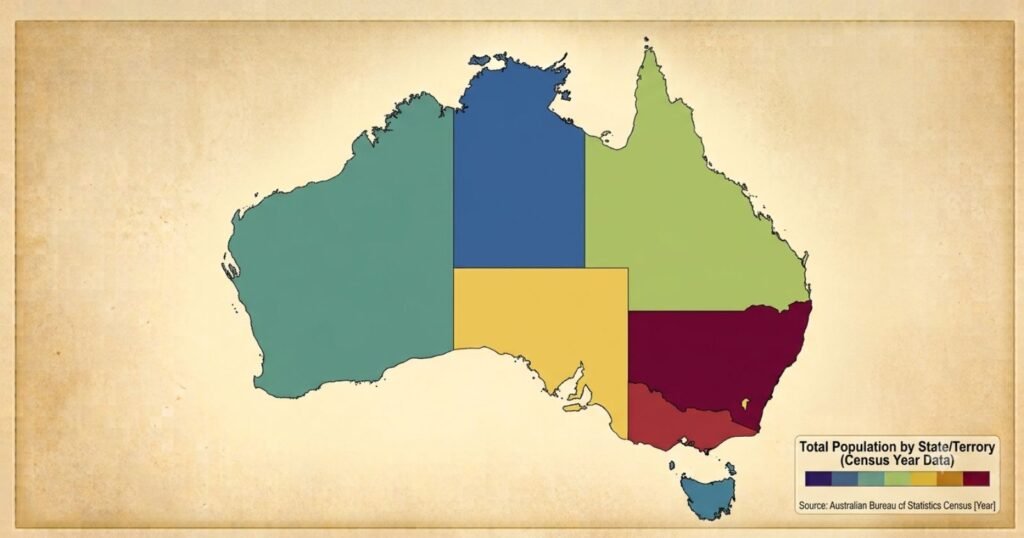
At 31 December 2025, Australia’s population stood at 27,801,023 people across six states, two mainland territories and a handful of smaller external territories. New South Wales remains the most populous state, home to just under a third of the country. The Northern Territory remains the smallest mainland jurisdiction, while several external territories, including Jervis Bay, Christmas Island and Norfolk Island, sit outside the core eight-jurisdiction ranking entirely.
Population by State and Territory
| Rank | State/Territory | Population (Dec 2025) | Annual growth rate | Share of Australia |
|---|---|---|---|---|
| 1 | New South Wales | 8,641,100 | 1.23% | 31.1% |
| 2 | Victoria | 7,121,900 | 1.67% | 25.6% |
| 3 | Queensland | 5,712,100 | 1.64% | 20.6% |
| 4 | Western Australia | 3,076,500 | 2.17% | 11.1% |
| 5 | South Australia | 1,910,600 | 1.04% | 6.9% |
| 6 | Tasmania | 579,100 | 0.50% | 2.1% |
| 7 | Australian Capital Territory | 487,200 | 1.25% | 1.8% |
| 8 | Northern Territory | 267,500 | 1.61% | 1.0% |
| — | Other Territories | ~5,000 | — | <0.1% |
Together, NSW, Victoria and Queensland hold more than three-quarters of Australia’s entire population, a concentration that has remained remarkably stable for well over a century.
New South Wales
Population and historical growth
NSW has been Australia’s most populous jurisdiction since Federation and shows no sign of relinquishing that position. Its growth rate, 1.23% in the year to December 2025, now trails the national average, a pattern that has persisted for much of the past decade as growth shifts toward Queensland and Western Australia.
Migration and Sydney’s concentration
Sydney anchors the state overwhelmingly, holding an estimated 65% of the state’s total population as of the 2021 Census. NSW absorbs large numbers of both international migrants and, historically, has also lost residents to interstate migration toward Queensland, a dynamic that has moderated its growth relative to smaller, faster-growing states.
Outlook
NSW is expected to retain its position as Australia’s largest state through at least the middle of the century, though its share of the national population is likely to continue drifting down slightly as Queensland and Western Australia grow faster.
Victoria
Population and growth trajectory
Victoria recorded 1.67% annual growth to December 2025, among the fastest of any state, restoring a growth lead it briefly lost during the COVID-19 period when Melbourne recorded net population declines for the first time in the city’s modern history. Before the pandemic, Victoria had spent most of the 2010s as Australia’s fastest-growing state.
Melbourne vs regional Victoria
Melbourne holds an estimated 76% of the state’s population, one of the highest capital-city concentrations of any mainland state. Melbourne alone added 2.4 million people between 1971 and 2021, the largest absolute capital-city growth of any Australian city over that fifty-year span.
Queensland
Interstate migration magnet
Queensland is the only state that consistently gains population from every other state and territory through net interstate migration, a pattern driven by lifestyle relocation, retirement migration and relative housing affordability compared with Sydney and Melbourne.
South-East Queensland growth corridor
Growth is heavily concentrated in the south-east corner of the state, stretching from the Gold Coast through Brisbane to the Sunshine Coast, which continues to absorb the bulk of both interstate and overseas arrivals into Queensland.
Western Australia
Resources-driven migration and current fastest-growth status
Western Australia recorded 2.17% annual growth to December 2025, the fastest of any state or territory, extending a run that has now held for several consecutive years. Growth is driven overwhelmingly by net overseas migration tied to resources-sector employment, echoing the pattern that made WA the fastest-growing state through much of 2024 as well.
Perth vs mining regions
Perth holds an estimated 80% of the state’s population, yet the remainder of Western Australia, dominated by remote mining regions, shows a starkly different demographic profile, with far higher male concentrations tied to fly-in fly-out mining workforces than Perth itself.
South Australia
Slower growth profile
South Australia grew 1.04% in the year to December 2025, below the national average and among the slower-growing mainland states, a pattern that has held for most of the past two decades.
Adelaide concentration
Adelaide holds an estimated 79% of the state’s population, among the highest capital-city concentrations in the country, reflecting South Australia’s comparatively limited regional population growth outside its capital.
Tasmania
Slowest-growing state
Tasmania recorded just 0.50% annual growth to December 2025, the slowest of any state or territory, a position it has held consistently for years. This slow growth compounds Tasmania’s status as Australia’s oldest state by median age, since younger residents are more likely to leave for education and work on the mainland than arrive from it.
Hobart vs rest of state
Hobart holds an estimated 45% of the state’s population, one of the lowest capital-city concentrations of any Australian jurisdiction, reflecting Tasmania’s comparatively dispersed regional population.
Australian Capital Territory
Smallest by area, public-service-driven population
The ACT is Australia’s smallest jurisdiction by land area and its population is effectively synonymous with Canberra, since the territory contains almost no population outside the capital. Growth is closely tied to Commonwealth public service employment and the territory’s universities.
Growth despite small base
Despite its small size, the ACT grew 1.25% in the year to December 2025, close to the national average, and Canberra was among the fastest-growing capital cities in percentage terms over the 50 years to 2021, up 200% since 1971.
Northern Territory
Smallest and youngest population, volatility in growth
The Northern Territory remains Australia’s smallest mainland jurisdiction by population, at 267,500 people, but recorded a relatively strong 1.61% growth rate in the year to December 2025. NT growth has historically been more volatile than other jurisdictions, occasionally recording outright population decline during periods of weak resources investment or reduced defense and public-sector activity.
Darwin vs remote NT
Darwin holds an estimated 60% of the territory’s population, with the remainder spread across some of the most remote and sparsely populated communities in the country, many with large Aboriginal populations.
Which States Are Growing Fastest?
| Rank | State/Territory | Annual growth rate (year to Dec 2025) |
|---|---|---|
| 1 | Western Australia | 2.17% |
| 2 | Victoria | 1.67% |
| 3 | Queensland | 1.64% |
| 4 | Northern Territory | 1.61% |
| 5 | Australian Capital Territory | 1.25% |
| 6 | New South Wales | 1.23% |
| 7 | South Australia | 1.04% |
| 8 | Tasmania | 0.50% |
Which States Are Growing Slowest?
Tasmania has recorded the slowest growth rate of any state or territory in every recent quarterly release, a pattern driven by weaker net overseas migration relative to its population and continued net interstate migration losses of younger residents to the mainland.
Capital Cities vs Rest of State
| Capital city | Estimated share of state/territory population |
|---|---|
| Canberra (ACT) | ~99% |
| Perth (WA) | ~80% |
| Adelaide (SA) | ~79% |
| Melbourne (Vic) | ~76% |
| Sydney (NSW) | ~65% |
| Darwin (NT) | ~60% |
| Brisbane (Qld) | ~50% |
| Hobart (Tas) | ~45% |
Capital-city concentration varies enormously across the country. In 1999, Melbourne, Adelaide and Perth each already held around 73% of their state’s population, while Brisbane and Darwin sat at just 46%, and Hobart at 41%, a gap between the most and least capital-dominated jurisdictions that has persisted, largely unchanged in relative terms, for over two decades.
Regional Australia
Nationally, the share of Australians living in a capital city rose from 65% in 1971 to 67% in 2021, meaning regional Australia has grown more slowly than the capitals overall, even as some individual regional areas, particularly coastal lifestyle destinations in Queensland and northern NSW, have grown briskly. Inland agricultural and remote mining towns have generally continued losing population relative to both the capitals and the coastal regional centers, a divergence that widened further during the post-pandemic remote-work-driven shift toward coastal and near-capital regional living.
Historical State Population
| State/Territory | 1921 | Approx. 1954 | Approx. 1981 | Approx. 2001 | 2021 (Census) | Dec 2025 |
|---|---|---|---|---|---|---|
| New South Wales | 2,100,371 | ~3.42 million | ~5.13 million | ~6.37 million | 8,072,163 | 8,641,100 |
| Victoria | 1,531,280 | ~2.45 million | ~3.83 million | ~4.64 million | 6,503,491 | 7,121,900 |
| Queensland | 755,972 | ~1.32 million | ~2.30 million | ~3.47 million | 5,185,993 | 5,712,100 |
| South Australia | 495,160 | ~0.80 million | ~1.35 million | ~1.47 million | 1,770,433 | 1,910,600 |
| Western Australia | 332,732 | ~0.64 million | ~1.30 million | ~1.83 million | 2,750,204 | 3,076,500 |
| Tasmania | 213,780 | ~0.31 million | ~0.43 million | ~0.46 million | 557,571 | 579,100 |
| Northern Territory | 3,867 | ~0.02 million | ~0.12 million | ~0.19 million | 246,700 | 267,500 |
| Australian Capital Territory | 2,572 | ~0.03 million | ~0.23 million | ~0.31 million | 454,499 | 487,200 |
| Australia | 5,435,734 | ~8.99 million | ~14.58 million | ~18.77 million | 25,422,788 | 27,801,023 |
Figures for 1954, 1981 and 2001 are approximate historical census counts; 1921 and Census-year figures are exact. What stands out across the full century is how stable the relative order has remained: NSW, Victoria and Queensland have held the top three positions in that exact order since at least 1921.
State Population Projections
Under the Centre for Population’s baseline national scenario, which places Australia’s total population around 33 to 34 million by 2050, state-level growth is expected to remain uneven. Western Australia and Queensland are projected to continue growing faster than the national average, sustained by resources employment and interstate lifestyle migration respectively. Victoria is expected to return to strong growth after its pandemic-era dip, potentially challenging NSW’s population lead within several decades if current relative growth rates persist. Tasmania and South Australia are projected to continue growing more slowly than the national average, while the Northern Territory’s outlook remains the most volatile of any jurisdiction, tied closely to resources investment cycles and defense posture decisions.
How Australia’s Population Geography Could Change by 2050
If Victoria’s recent growth rate advantage over NSW persists for several more decades, Victoria could close a meaningful share of the gap with NSW’s population lead by mid-century, though NSW’s larger existing base means an outright overtake remains unlikely before 2050 under most scenarios. Western Australia’s sustained fast growth is likely to lift its national population share from just over 11% today toward a somewhat larger share by 2050, while Tasmania’s share is likely to continue slowly shrinking. The overall pattern, coastal state capitals absorbing the vast majority of national growth while regional and remote areas grow far more slowly, is expected to persist rather than reverse.
Complete State and Territory Population Table
| State/Territory | Population (Dec 2025) | Land area (km²) | Approx. density (people/km²) | Annual growth |
|---|---|---|---|---|
| New South Wales | 8,641,100 | 800,642 | 10.8 | 1.23% |
| Victoria | 7,121,900 | 227,444 | 31.3 | 1.67% |
| Queensland | 5,712,100 | 1,729,742 | 3.3 | 1.64% |
| Western Australia | 3,076,500 | 2,527,013 | 1.2 | 2.17% |
| South Australia | 1,910,600 | 983,482 | 1.9 | 1.04% |
| Tasmania | 579,100 | 68,401 | 8.3 | 0.50% |
| Australian Capital Territory | 487,200 | 2,358 | ~199 | 1.25% |
| Northern Territory | 267,500 | 1,419,630 | 0.18 | 1.61% |
Key Findings
- New South Wales remains Australia’s most populous jurisdiction with 8.64 million people, or 31.1% of the national total
- Western Australia is currently the fastest-growing state or territory, at 2.17% annual growth, driven by resources-sector migration
- Tasmania is the slowest-growing state, at 0.50% annual growth, a position it has held consistently in recent years
- NSW, Victoria and Queensland together hold more than three-quarters of Australia’s population, a concentration that has persisted since at least 1921
- Capital-city concentration ranges from around 99% in the ACT to around 45% in Tasmania
- The national capital-city population share rose from 65% in 1971 to 67% in 2021
- Under baseline projections, Western Australia and Queensland are expected to keep growing faster than the national average through 2050
Frequently Asked Questions
1. Which is the most populous state in Australia?
New South Wales, with 8,641,100 people as of December 2025, representing 31.1% of the national population.
2. Which state or territory has the smallest population?
The Northern Territory, excluding the smaller external territories, with 267,500 people as of December 2025.
3. Which state is growing fastest in Australia?
Western Australia, at 2.17% annual growth in the year to December 2025, well above the national average of 1.51%.
4. Which state is growing slowest?
Tasmania, at 0.50% annual growth in the year to December 2025.
5. What share of Australia’s population lives in NSW, Victoria and Queensland combined?
More than three-quarters, a concentration that has held since at least the 1921 Census.
6. Which state has the highest capital city concentration?
The Australian Capital Territory, where the population is almost entirely concentrated in Canberra, followed by Western Australia and South Australia at around 79 to 80%.
7. Which state has the lowest capital city concentration?
Tasmania, where Hobart holds an estimated 45% of the state’s population, followed by Queensland at around 50%.
8. Could Victoria ever overtake NSW as Australia’s most populous state?
It is possible over a multi-decade horizon if Victoria’s faster recent growth rate persists, but NSW’s larger existing population base makes an overtake unlikely before 2050 under most projection scenarios.
9. Why does Queensland gain population from every other state?
Lifestyle relocation, retirement migration and relative housing affordability compared with Sydney and Melbourne consistently drive positive net interstate migration into Queensland from every other jurisdiction.
10. How has Australia’s state population ranking changed since Federation?
Remarkably little. New South Wales, Victoria and Queensland have held the top three positions in that order since at least the 1921 Census, with only the smaller states and territories changing relative rank over time.
Sources
- Australian Bureau of Statistics, National, state and territory population, December 2025
- Australian Bureau of Statistics, Historical population, 2021
- Australian Bureau of Statistics, 50 years of capital city population change
- Centre for Population, National, State and Territory Population, March 2025
- Tasmanian Department of Treasury and Finance, National, State and Territory Population, December quarter 2025
- Australian Bureau of Statistics, 1921 Census results (Commonwealth Bureau of Census and Statistics)
- Australian Bureau of Statistics, Regional Population Growth, Australia, 1998-99