
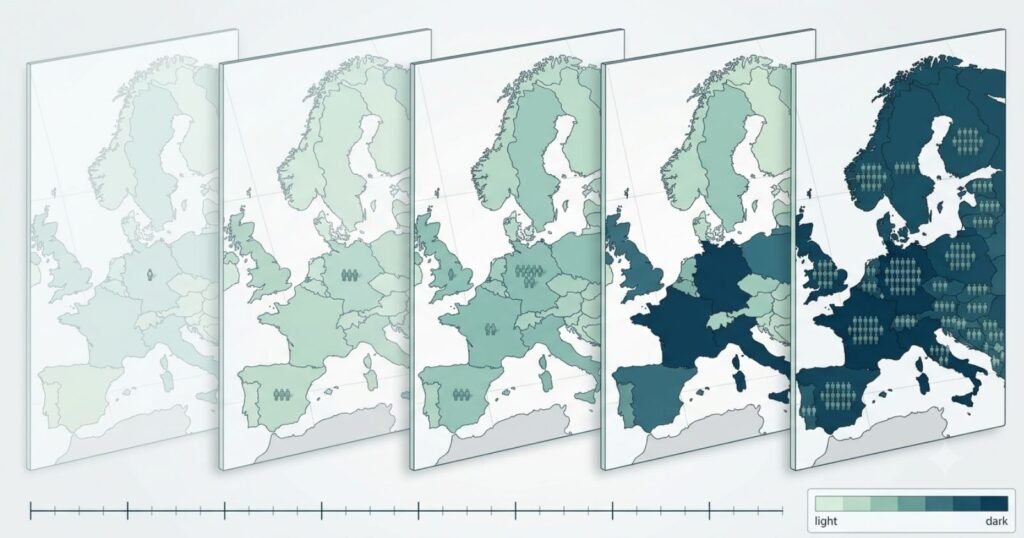
Somewhere around 2020, without a headline or an announcement, Europe’s population quietly stopped growing. It has been sliding, slowly, ever since. That single fact, buried in seventy years of United Nations demographic data, is the real story behind Europe’s population numbers, and it only becomes visible when you lay the years out side by side instead of looking at any single year in isolation.
The Year-by-Year Population Table
| Year | Europe Population | Yearly Change | Net Migration (avg annual) | Median Age | Fertility Rate | Urban Population % |
|---|---|---|---|---|---|---|
| 1955 | 575,443,529 | +0.95% | -286,783 | 28.4 | 2.62 | 54.6% |
| 1960 | 605,817,186 | +1.03% | -324,449 | 29.3 | 2.59 | 57.4% |
| 1965 | 634,412,814 | +0.93% | -9,318 | 29.9 | 2.44 | 60.4% |
| 1970 | 656,998,548 | +0.70% | -757,514 | 30.8 | 2.28 | 63.2% |
| 1975 | 677,279,665 | +0.61% | -43,136 | 31.3 | 2.07 | 65.6% |
| 1980 | 694,278,649 | +0.50% | +851,416 | 31.5 | 1.93 | 67.6% |
| 1985 | 708,940,412 | +0.42% | +488,771 | 32.4 | 1.83 | 68.8% |
| 1990 | 724,139,404 | +0.43% | +981,962 | 33.6 | 1.72 | 69.7% |
| 1995 | 729,380,599 | +0.14% | +697,374 | 35.0 | 1.45 | 70.4% |
| 2000 | 728,164,209 | -0.03% | +1,212,081 | 36.6 | 1.41 | 71.0% |
| 2005 | 732,046,515 | +0.11% | +1,529,667 | 38.0 | 1.46 | 71.8% |
| 2010 | 738,145,318 | +0.17% | +1,119,290 | 39.3 | 1.61 | 72.8% |
| 2015 | 744,237,035 | +0.16% | +2,115,789 | 40.4 | 1.60 | 73.5% |
| 2020 | 749,524,044 | +0.14% | +1,459,606 | 41.5 | 1.47 | 74.3% |
| 2022 | 746,964,593 | -0.17% | +12,816 | 41.9 | 1.41 | 75.0% |
| 2023 | 745,602,875 | -0.18% | +1,510,377 | 42.2 | 1.40 | 75.3% |
| 2024 | 745,083,824 | -0.07% | +1,566,027 | 42.5 | 1.40 | 75.6% |
| 2025 | 744,398,832 | -0.09% | +1,478,090 | 42.8 | 1.41 | 75.9% |
| 2026 | 743,482,361 | -0.12% | +1,299,979 | 43.1 | 1.41 | 76.2% |
| 2030 (forecast) | 738,433,454 | -0.16% | +1,189,403 | 44.2 | 1.44 | 77.6% |
| 2035 (forecast) | 730,590,510 | -0.21% | +1,140,222 | 45.5 | 1.47 | 79.4% |
| 2040 (forecast) | 722,101,623 | -0.23% | +1,092,076 | 46.4 | 1.48 | 81.4% |
| 2045 (forecast) | 713,279,853 | -0.25% | +1,090,468 | 46.5 | 1.49 | 83.3% |
| 2050 (forecast) | 703,027,759 | -0.29% | +1,079,512 | 46.2 | 1.50 | 85.2% |
Source: UN World Population Prospects 2024 Revision, medium-fertility variant. Years before 2020 shown at five-year benchmark intervals as reported by the source; 2020 onward shown annually where available. Figures are as of July 1 of each stated year.
1955, the Starting Line
In the mid-1950s, Europe’s population sat at roughly 575 million, growing by nearly 1 percent a year, faster than the continent has grown at any point since. Crucially, that growth was not driven by migration. Net migration was negative, meaning more people were leaving Europe than arriving, largely due to postwar emigration to North America, Australia, and Latin America. Growth came almost entirely from natural increase, births far outnumbering deaths, with a fertility rate of 2.62 children per woman, comfortably above the replacement level of roughly 2.1.
The 1950s and 1960s, Postwar Momentum
Through the late 1950s and 1960s, Europe’s population climbed from 575 million to 634 million, adding nearly 60 million people in a decade, its fastest sustained expansion in the modern data record. This was the classic postwar baby boom, fueled by rising living standards, expanding healthcare systems, and a wave of family formation delayed by the war years. Fertility remained above 2.4 children per woman throughout the period even as net migration stayed negative, with Europeans still emigrating abroad in large numbers.
The 1970s, the Fertility Transition Begins
The 1970s mark the first visible bend in the curve. Fertility fell from 2.28 in 1970 to 1.93 by 1980, a drop of over 15 percent in a single decade, as contraception became widely available, women’s workforce participation expanded, and family size norms shifted across Western Europe in particular. Population growth continued, but the engine driving it was starting to change. By 1980, for the first time in the dataset, net migration turned positive, meaning Europe was gaining more people through migration than it was losing.
The 1980s, Growth Slows but Migration Takes Over
Population growth in the 1980s slowed to roughly 0.4 to 0.5 percent a year, about half the rate of the 1960s. Fertility kept falling, reaching 1.72 by 1990, already below replacement level. Positive net migration, nearly 1 million people a year by 1990, began doing more of the work that births alone used to do. This decade is the hinge point of the entire seventy-year series, the moment Europe shifted from a naturally growing population to one that would eventually depend on migration just to avoid shrinking.
The 1990s, Political Transformation and a Population Dip
The 1990s were shaped less by demographics than by politics. The collapse of the Soviet Union and Eastern Bloc governments triggered major population shifts, including emigration from former communist states toward Western Europe, and a mortality crisis in parts of the former Soviet Union linked to economic collapse and public health system breakdown. Fertility fell sharply again, from 1.72 in 1990 to 1.41 by 2000. The result shows clearly in the table, population growth nearly stalled by 1995 and then briefly went negative between 1995 and 2000, the only sustained multi-year contraction in the record before the 2020s. Positive net migration, over 1.2 million a year by 2000, was the only thing keeping Europe’s total population from falling further.
The 2000s, Migration Becomes the Main Driver
By the 2000s, net migration into Europe had grown to over 1.5 million people a year on average, easily outpacing what natural increase alone could deliver given a fertility rate still stuck near 1.4 to 1.6. EU enlargement in 2004 and 2007 opened intra-European mobility on a scale not seen before, and non-EU migration, including labor migration and family reunification, added further to the total. Population growth resumed, climbing back above 730 million by 2005 and past 738 million by 2010.
The 2010s, Growth Peaks Then Starts to Fade
Europe’s population grew steadily through the first half of the 2010s, reaching an all-time high close to 750 million around 2019 to 2020, helped by a migration surge that included the 2015 to 2016 refugee movements linked to the Syrian civil war and other conflicts, which briefly pushed net migration above 2.1 million in a single year. But the underlying fertility rate never recovered meaningfully, hovering between 1.4 and 1.6 throughout the decade, and Europe’s median age climbed past 40 for the first time in the dataset. The seeds of the coming decline were already in the age structure even while the total population was still rising.
The 2020s, the Turning Point Becomes Visible
This is the decade where the numbers actually turn. Population fell from roughly 749.5 million in 2020 to 743.5 million in 2026, a decline of about 6 million people in six years. Several forces converged, a mortality spike tied to the COVID-19 pandemic, a continued and in places accelerating fertility decline, war-related displacement following Russia’s 2022 invasion of Ukraine, and an aging population structure in which deaths now regularly exceed births across large parts of the continent even with migration factored in. Net migration remained strongly positive throughout, often above 1.3 million a year, but for the first time in the seventy-year record it was not enough to offset natural decline.
Has Europe’s Population Already Peaked
Based on the data available, the honest answer is probably yes, sometime around 2019 to 2020, at a level close to 749 to 750 million. Every year since has shown either a decline or only marginal growth, and every year in the UN’s medium-fertility projection through 2050 shows continued decline. This does not rule out a future rebound if fertility rises or migration increases substantially, both of which the UN’s high-fertility and high-migration scenarios allow for, but under the medium, most-likely scenario used throughout this article, Europe has already seen its largest population and will not return to it this century.
What Comes Next, the Projection Table
| Milestone | Year | Population | What Changes |
|---|---|---|---|
| Recent historical peak | 2019 to 2020 | ~749.5 million | Highest recorded population in the modern data series |
| Current | 2026 | 743.5 million | Sixth consecutive year of decline or stagnation |
| Near-term forecast | 2030 | 738.4 million | Continued gradual decline, migration still positive |
| Mid-term forecast | 2040 | 722.1 million | Median age passes 46, urban share passes 81% |
| Long-term forecast | 2050 | 703.0 million | Population roughly back to where it stood around 1988 |
Natural Change Versus Migration, a Seventy Year Comparison
The clearest way to see how Europe’s growth engine has changed is to compare what was driving population change in each era. In the 1950s and 1960s, natural increase, births minus deaths, did essentially all the work, while migration actively subtracted from the total as Europeans emigrated abroad.
By the 1980s the two forces were roughly balanced. From the 2000s onward, migration has been the dominant and often the only positive force, with natural change turning negative across much of the continent well before the total population itself started to fall, because migration was still large enough to mask the underlying deficit for roughly two more decades.
Frequently Asked Questions
What was Europe’s population in 1950?
The data series in this article begins at the 1955 benchmark, when Europe’s population stood at approximately 575.4 million; the 1950 figure was marginally lower.
What was Europe’s population in 2000?
Approximately 728.2 million, a level that was actually lower than the 1995 figure due to a brief population dip in the second half of the 1990s.
What is Europe’s population today?
Approximately 743.5 million as of the 2026 mid-year estimate.
When did Europe’s population peak?
The available data points to a peak around 2019 to 2020, near 749.5 million, under the UN’s medium-fertility projection scenario.
Is Europe’s population declining?
Yes. Europe’s population has declined or stagnated in most years since 2020, and UN projections show continued gradual decline through at least 2050.
Which decade saw the fastest population growth?
The 1960s, when Europe’s population grew from about 605.8 million to 634.4 million, an annual growth rate around 1 percent, the highest sustained rate in the seventy-year record.
Will Europe’s population keep shrinking after 2050?
The UN’s medium-fertility variant used in this article only extends confidently to 2050, but the underlying trends, low fertility and an aging population structure, suggest continued gradual decline is more likely than a rebound absent a substantial and sustained rise in migration or fertility.
Sources
- United Nations, Department of Economic and Social Affairs, Population Division,
- World Population Prospects 2024 Revision, medium-fertility variant.
- All figures as of July 1 of the stated year unless otherwise noted.





