
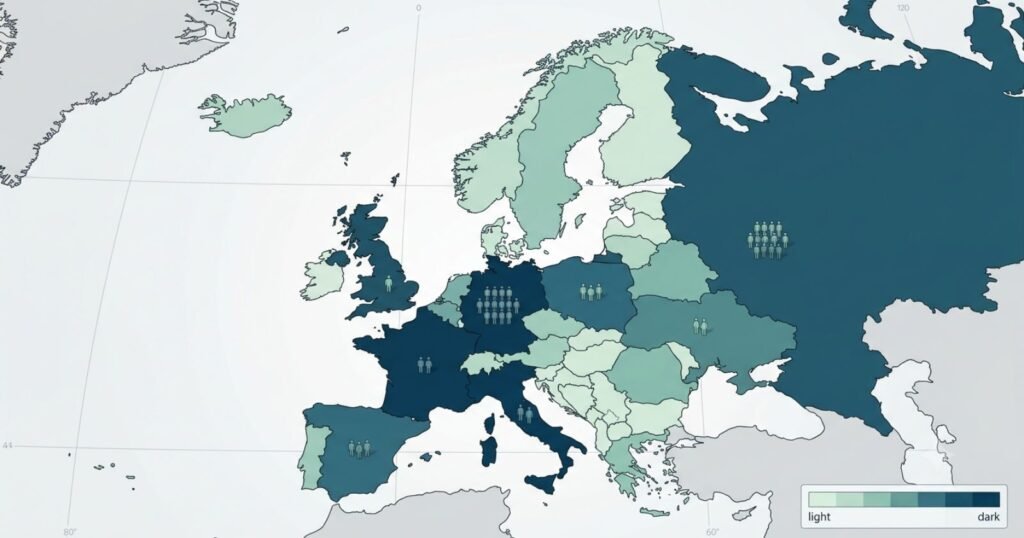
Europe is home to 743.5 million people in 2026, spread across 47 countries and territories that range from Russia, with more than 143 million residents, to the Holy See, with barely 500. No other continent packs such a wide spread of population sizes into such a compact land area, and no single number, “Europe has 743 million people,” tells you much about what is actually happening on the ground in Warsaw, Dublin, or Chisinau.
Population totals for “Europe” vary between sources because there is no single agreed border. Some datasets stop at the Ural Mountains and exclude Turkey, Kazakhstan, and the Caucasus states entirely. Others include Cyprus, Georgia, Armenia, and Azerbaijan because of political or EU-association ties even though they sit partly or wholly in Asia geographically.
This article uses the United Nations geographic definition of Europe, as compiled by Worldometer from UN World Population Prospects 2024 Revision data, medium-fertility variant. That definition covers 47 sovereign states, micro-states, and dependencies, including Russia’s full population (not just its European portion), the United Kingdom, and all EU and non-EU states through the Balkans. It excludes Turkey, the South Caucasus states, and Kazakhstan, which are typically treated as transcontinental or Asian in UN regional classifications. Where other sources define Europe differently, a country’s rank can shift by several places, so any comparison between this table and another site’s ranking should first check which countries were actually counted.
The Complete Country Ranking Table
| Rank | Country | Population 2026 | Yearly Change | Density (people/km2) | Fertility Rate | Median Age | Urban Pop % | Share of Europe |
|---|---|---|---|---|---|---|---|---|
| 1 | Russia | 143,394,458 | -0.42% | 9 | 1.5 | 41 | 75% | 19.3% |
| 2 | Germany | 83,644,258 | -0.51% | 240 | 1.5 | 46 | 77% | 11.2% |
| 3 | United Kingdom | 69,931,528 | 0.55% | 289 | 1.5 | 40 | 85% | 9.4% |
| 4 | France | 66,746,401 | 0.14% | 122 | 1.6 | 42 | 83% | 9.0% |
| 5 | Italy | 58,926,166 | -0.37% | 200 | 1.2 | 49 | 72% | 7.9% |
| 6 | Spain | 47,850,793 | -0.08% | 96 | 1.2 | 46 | 80% | 6.4% |
| 7 | Ukraine | 39,535,849 | 1.43% | 68 | 1.0 | 42 | 75% | 5.3% |
| 8 | Poland | 37,843,188 | -0.78% | 124 | 1.3 | 43 | 60% | 5.1% |
| 9 | Romania | 18,800,605 | -0.57% | 82 | 1.7 | 43 | 55% | 2.5% |
| 10 | Netherlands | 18,448,775 | 0.56% | 547 | 1.4 | 42 | 89% | 2.5% |
| 11 | Belgium | 11,774,642 | 0.14% | 389 | 1.4 | 42 | 99% | 1.6% |
| 12 | Sweden | 10,701,047 | 0.42% | 26 | 1.4 | 40 | 88% | 1.4% |
| 13 | Czechia | 10,527,781 | -0.77% | 136 | 1.5 | 44 | 76% | 1.4% |
| 14 | Portugal | 10,395,362 | -0.16% | 113 | 1.5 | 47 | 67% | 1.4% |
| 15 | Greece | 9,897,115 | -0.42% | 77 | 1.3 | 47 | 90% | 1.3% |
| 16 | Hungary | 9,585,818 | -0.48% | 106 | 1.5 | 44 | 72% | 1.3% |
| 17 | Austria | 9,107,266 | -0.07% | 111 | 1.3 | 44 | 59% | 1.2% |
| 18 | Switzerland | 9,007,798 | 0.45% | 228 | 1.4 | 43 | 75% | 1.2% |
| 19 | Belarus | 8,937,018 | -0.67% | 44 | 1.2 | 42 | 85% | 1.2% |
| 20 | Bulgaria | 6,667,659 | -0.70% | 61 | 1.7 | 45 | 77% | 0.9% |
| 21 | Serbia | 6,641,964 | -0.70% | 76 | 1.5 | 45 | 74% | 0.9% |
| 22 | Denmark | 6,023,520 | 0.35% | 142 | 1.5 | 41 | 88% | 0.8% |
| 23 | Norway | 5,652,989 | 0.53% | 15 | 1.4 | 40 | 87% | 0.8% |
| 24 | Finland | 5,621,739 | -0.03% | 18 | 1.3 | 43 | 87% | 0.8% |
| 25 | Slovakia | 5,451,342 | -0.43% | 113 | 1.6 | 43 | 54% | 0.7% |
| 26 | Ireland | 5,356,950 | 0.92% | 78 | 1.6 | 39 | 62% | 0.7% |
| 27 | Croatia | 3,822,345 | -0.67% | 68 | 1.5 | 46 | 62% | 0.5% |
| 28 | Bosnia and Herzegovina | 3,114,242 | -0.82% | 61 | 1.5 | 46 | 57% | 0.4% |
| 29 | Moldova | 2,961,253 | -1.16% | 90 | 1.7 | 39 | 58% | 0.4% |
| 30 | Lithuania | 2,797,338 | -1.16% | 45 | 1.2 | 43 | 69% | 0.4% |
| 31 | Albania | 2,751,025 | -0.74% | 100 | 1.3 | 38 | 72% | 0.4% |
| 32 | Slovenia | 2,114,573 | -0.12% | 105 | 1.6 | 45 | 56% | 0.3% |
| 33 | Latvia | 1,835,935 | -0.95% | 30 | 1.4 | 44 | 68% | 0.2% |
| 34 | North Macedonia | 1,804,063 | -0.54% | 72 | 1.5 | 41 | 70% | 0.2% |
| 35 | Estonia | 1,331,062 | -0.98% | 31 | 1.4 | 43 | 68% | 0.2% |
| 36 | Luxembourg | 687,448 | 1.03% | 265 | 1.4 | 40 | 87% | 0.09% |
| 37 | Montenegro | 626,233 | -1.03% | 47 | 1.8 | 40 | 70% | 0.08% |
| 38 | Malta | 549,011 | 0.66% | 1,716 | 1.1 | 41 | 76% | 0.07% |
| 39 | Iceland | 402,329 | 1.02% | 4 | 1.5 | 37 | 84% | 0.05% |
| 40 | Isle of Man | 84,055 | -0.07% | 147 | 1.5 | 46 | 57% | 0.01% |
| 41 | Andorra | 83,753 | 1.02% | 178 | 1.1 | 44 | 82% | 0.01% |
| 42 | Faroe Islands | 56,526 | 0.94% | 40 | 2.2 | 37 | 40% | 0.008% |
| 43 | Gibraltar | 40,867 | 1.85% | 4,087 | 1.9 | 39 | 87% | 0.005% |
| 44 | Liechtenstein | 40,368 | 0.60% | 252 | 1.5 | 45 | 15% | 0.005% |
| 45 | Monaco | 38,087 | -0.66% | 25,562 | 2.1 | 53 | N/A | 0.005% |
| 46 | San Marino | 33,605 | 0.10% | 560 | 1.2 | 49 | N/A | 0.005% |
| 47 | Holy See | 506 | 1.00% | 1,265 | 1.0 | 56 | N/A | 0.00007% |
Source: Worldometer, elaboration of United Nations World Population Prospects 2024 Revision, medium-fertility variant. Reference date, 2026 mid-year estimate.
Europe’s Ten Giants
Ten countries hold more than 70 percent of Europe’s entire population. Russia alone accounts for nearly one in five Europeans, a figure that surprises people who picture Europe as dominated by Germany, France, and the UK. But Russia’s dominance comes from land area and Soviet-era population retention, not density. At 9 people per square kilometer, Russia is one of the emptiest places in the ranking, a reminder that population rank and population density are two entirely separate stories.
Germany, the UK, France, Italy, and Spain form the next tier, together holding roughly 44 percent of Europe’s people. All five are now either shrinking or growing only slowly. Italy and Spain post outright annual declines. Germany, despite being Europe’s economic engine, has lost population for four straight years as deaths outnumber births faster than migration can offset the gap. Only the UK and France sit in mild positive territory, and even there growth is closer to 0.1 to 0.6 percent than to anything resembling a baby boom.
Ukraine’s position at number 7 deserves a note. Its 2026 figure and the +1.43 percent yearly change reflect ongoing wartime population disruption, revised statistical methodology, and the return of some displaced people rather than organic demographic growth, and should be read with more caution than the other entries in this table.
The Middle Tier, Population Bands From One Million to Twenty Million
Grouping the remaining countries into bands shows how quickly Europe’s population thins out below the top ten.
| Population Band | Number of Countries | Countries |
|---|---|---|
| 10 million to 20 million | 6 | Poland, Romania, Netherlands, Belgium, Sweden, Czechia |
| 5 million to 10 million | 11 | Portugal, Greece, Hungary, Austria, Switzerland, Belarus, Bulgaria, Serbia, Denmark, Norway, Finland |
| 1 million to 5 million | 12 | Slovakia, Ireland, Croatia, Bosnia and Herzegovina, Moldova, Lithuania, Albania, Slovenia, Latvia, North Macedonia, Estonia |
| Under 1 million | 12 | Luxembourg, Montenegro, Malta, Iceland, Isle of Man, Andorra, Faroe Islands, Gibraltar, Liechtenstein, Monaco, San Marino, Holy See |
Nearly half of Europe’s 47 counted territories, 24 out of 47, have fewer than 5 million residents. This is one reason continent-wide averages can mislead. The “average” European country has around 15.8 million people, but the median country, the one sitting exactly in the middle of the ranking, has closer to 5.6 million, since a handful of population giants pull the average far above what a typical European nation actually looks like.
Europe’s Smallest Populations
At the bottom of the table sit micro-states whose entire population would fit inside a mid-sized European city district. The Holy See, with 506 residents, is not a conventional country in the demographic sense: it has no births, deaths, or family units in the usual pattern, and its population consists largely of clergy and Swiss Guard members.
San Marino, Monaco, and Liechtenstein are genuine sovereign states with ordinary demographic profiles but populations smaller than a single large secondary school district. Monaco’s density of over 25,000 people per square kilometer, the highest sovereign-state density on Earth, comes from packing roughly 38,000 residents into just over two square kilometers of Mediterranean coastline.
Population by Region
The UN groups Europe into four subregions, and the population split between them is far from even.
| Subregion | Population 2026 | Share of Europe |
|---|---|---|
| Eastern Europe | 284,452,005 | 38.3% |
| Western Europe | 199,671,205 | 26.9% |
| Southern Europe | 150,775,924 | 20.3% |
| Northern Europe | 109,499,697 | 14.7% |
Eastern Europe’s lead is almost entirely a function of Russia’s size. Strip Russia out of the Eastern Europe total and the region falls to roughly 141 million, putting it much closer to Western and Southern Europe. This is a useful check whenever a “region of Europe” statistic is quoted, since Russia’s population alone can flip which region appears largest depending on how it is counted.
How the Ranking Has Shifted
Europe’s population ranking is not static. Germany overtook a reunified population base after 1990 and has held second place ever since, but it has been losing that lead’s momentum, recording annual declines since 2022 as its death rate, driven by an aging population, consistently exceeds its birth rate.
Poland has slipped in relative position over the past two decades as large-scale emigration, particularly to the UK, Germany, and Ireland after Poland’s 2004 EU accession, combined with low fertility to shrink its working-age cohorts. Ukraine’s position has been the most volatile of any large country in the ranking, first through Crimea’s 2014 loss, then through wartime displacement and casualties after 2022.
Meanwhile Ireland has climbed steadily, powered by both natural increase and strong net migration tied to its tech and pharmaceutical sectors.
Fastest Growing and Fastest Shrinking
| Fastest Growing (2026 yearly change) | Rate | Fastest Shrinking (2026 yearly change) | Rate |
|---|---|---|---|
| Gibraltar | +1.85% | Moldova | -1.16% |
| Ukraine* | +1.43% | Lithuania | -1.16% |
| Luxembourg | +1.03% | Montenegro | -1.03% |
| Andorra | +1.02% | Estonia | -0.98% |
| Iceland | +1.02% | Latvia | -0.95% |
| Faroe Islands | +0.94% | Bosnia and Herzegovina | -0.82% |
| Ireland | +0.92% | Poland | -0.78% |
| Malta | +0.66% | Czechia | -0.77% |
| Liechtenstein | +0.60% | Albania | -0.74% |
| United Kingdom | +0.55% | Serbia and Bulgaria | -0.70% |
*Ukraine’s figure reflects wartime statistical volatility rather than a conventional growth pattern; see note above.
The countries at the top of the growth column share a pattern, small, wealthy, migration-friendly economies (Luxembourg, Iceland, Andorra, Ireland) where net migration outweighs low fertility. The countries at the bottom share a different pattern, mid-sized economies with high emigration of working-age adults toward Western Europe combined with fertility well below replacement level.
Forecast to 2050, and How the Ranking May Change
| Year | Europe Population | Yearly Change | Median Age | Fertility Rate |
|---|---|---|---|---|
| 2026 | 743,482,361 | -0.12% | 43.1 | 1.41 |
| 2030 | 738,433,454 | -0.16% | 44.2 | 1.44 |
| 2035 | 730,590,510 | -0.21% | 45.5 | 1.47 |
| 2040 | 722,101,623 | -0.23% | 46.4 | 1.48 |
| 2045 | 713,279,853 | -0.25% | 46.5 | 1.49 |
| 2050 | 703,027,759 | -0.29% | 46.2 | 1.50 |
Source, UN World Population Prospects 2024 Revision, medium-fertility variant, elaborated by Worldometer.
By 2050, Europe’s total population is projected to fall to roughly 703 million, a loss of about 40 million people from today, while the median age climbs from 43.1 to 46.2.
At the country level, the countries currently near the top of the shrinking list, the Baltic states, Bulgaria, Serbia, and Bosnia and Herzegovina, are the most likely to see their rankings fall further, some potentially losing a quarter or more of their current population by mid-century absent a major migration reversal. Ireland, Luxembourg, and the Nordic countries are the most likely to hold or improve their relative position, provided current migration patterns continue.
Population Versus Density, Why Rank Is Not the Whole Story
A country’s population rank and its population density often point in opposite directions. Russia ranks first in population but sits near the bottom in density, at 9 people per square kilometer. Malta ranks 38th in population, with barely half a million people, but has one of the highest densities on the continent, at 1,716 people per square kilometer, because that population is packed onto a tiny archipelago. The lesson for interpreting any “biggest countries in Europe” ranking is to ask immediately whether “biggest” means most people or most crowded, since the two lists barely overlap.
Frequently Asked Questions
Which is the most populous country in Europe?
Russia, with approximately 143.4 million people in 2026, is the most populous country counted within Europe under the UN’s geographic definition.
What is the least populous country in Europe?
The Holy See (Vatican City), with roughly 506 residents, is the smallest by population, followed by San Marino, Monaco, and Liechtenstein.
How many countries are in Europe?
This ranking includes 47 sovereign states, micro-states, and dependencies under the UN’s geographic definition. Other sources may count between 44 and 51 depending on whether transcontinental states like Turkey, Georgia, Armenia, and Azerbaijan are included.
Is Europe’s population growing or shrinking?
Europe’s total population is shrinking slightly, down about 0.12% in 2026, and UN projections show a continued gradual decline to roughly 703 million by 2050.
Which European country is growing fastest?
Among larger countries, Ireland and Luxembourg post the strongest sustained growth, driven mainly by net migration rather than births exceeding deaths.
Which European country is shrinking fastest?
Moldova and Lithuania currently show the steepest annual population declines, both losing more than 1% of their population per year through a combination of low fertility and emigration.
Sources
- United Nations, Department of Economic and Social Affairs, Population Division,
- World Population Prospects 2024 Revision, medium-fertility variant.





