
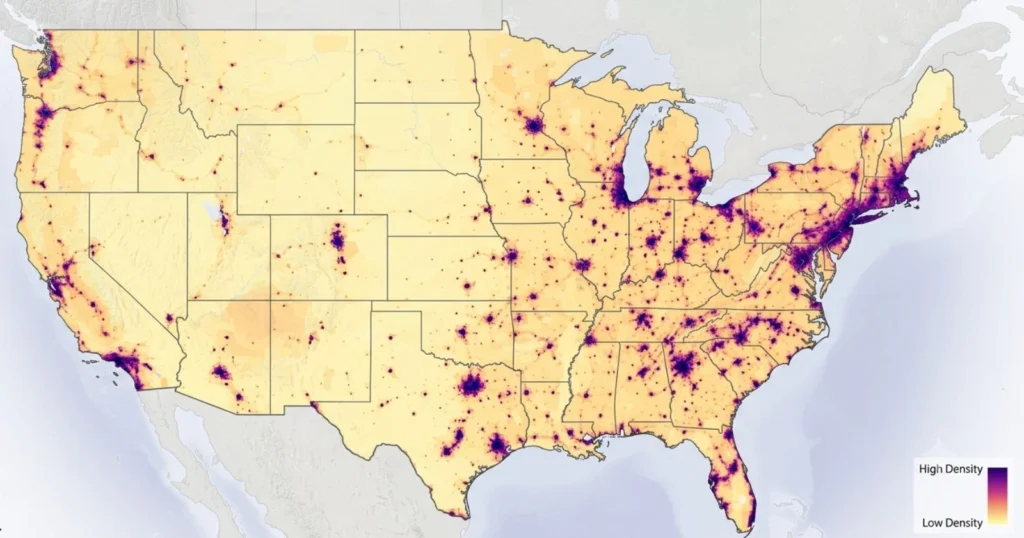
Population density measures how many people live within a given unit of land, typically expressed as persons per square mile in the United States. The metric offers a practical way to understand how a nation’s living space is shared among its residents and how that pattern shifts as births, deaths, and migration reshape the population over time.
The United States has moved from a sparsely settled frontier country to a nation of more than 341 million residents. Its overall density remains modest compared to many other developed nations, largely because of its vast land area, but the number has climbed steadily for more than a century. This article reviews the long-term historical pattern, the last decade of official estimates, the present-day figure, and the population density levels projected through the year 2100.
What Is Population Density and Why Does It Matter
Population density is calculated by dividing the total population by the total land area, usually expressed as persons per square mile in US statistics or persons per square kilometer internationally. The United States Census Bureau calculates this figure using land area alone, excluding lakes, rivers, and other inland water bodies.
The measure matters for several practical reasons:
- It helps policymakers plan infrastructure such as roads, schools, hospitals, and utilities.
- It informs housing markets, real estate development, and zoning decisions.
- It supports public health planning, including disease spread modeling and emergency response.
- It reveals regional imbalances between crowded coastal corridors and sparsely populated interior states.
- It shapes congressional apportionment and representation across states.
A national average density figure can mask significant internal variation. The United States, taken as a whole, has a density far lower than compact nations such as the Netherlands or South Korea, yet specific American cities and coastal counties rank among the densest places on Earth.
Track Real-time United States Population Growth @ USA POPULATION CLOCK
Historical Population Density Trends in the USA (1900 to 2020)
Population density in the United States grew steadily through the twentieth century as the population expanded through natural increase and immigration, even as the country’s land area became fixed after Alaska and Hawaii joined the union in 1959. The table below tracks density at each decennial census from 1900 through 2020, using the U.S. Census Bureau’s historical apportionment data.
| Census Year | Total Population (millions) | Population Density (persons per sq mile) |
|---|---|---|
| 1900 | 76.2 | 25.6 |
| 1910 | 92.2 | 31.0 |
| 1920 | 106.0 | 35.6 |
| 1930 | 123.2 | 41.2 |
| 1940 | 132.1 | 44.2 |
| 1950 | 151.3 | 50.7 |
| 1960 | 179.3 | 50.6 |
| 1970 | 203.2 | 57.5 |
| 1980 | 226.5 | 64.0 |
| 1990 | 248.7 | 70.3 |
| 2000 | 281.4 | 79.6 |
| 2010 | 308.7 | 87.4 |
| 2020 | 331.4 | 93.8 |
Source: U.S. Census Bureau, Historical Population Density Data.
A few patterns stand out in this long view:
- Density roughly quadrupled between 1900 and 2020, rising from about 26 people per square mile to nearly 94.
- The addition of Alaska in 1959 briefly slowed density growth for that census cycle, since Alaska’s enormous land area was added to the national total while contributing a very small population.
- The fastest single-decade jump occurred between 1990 and 2000, when the population grew by close to 33 million people, the largest census-to-census increase in the nation’s history.
- Growth slowed somewhat after 2000 as birth rates declined and immigration patterns shifted, though density continued to rise every decade.
USA Population Density Over the Last 10 Years (2016 to 2025)
Annual population estimates from the Census Bureau’s Population Estimates Program allow a closer look at how density has changed year by year over the most recent decade. These figures use the resident population estimate for July 1 of each year, divided by the fixed national land area of 3,531,905 square miles.
| Year | Estimated Population (millions) | Population Density (persons per sq mile) |
|---|---|---|
| 2016 | 323.1 | 91.5 |
| 2017 | 325.1 | 92.1 |
| 2018 | 326.8 | 92.5 |
| 2019 | 328.2 | 92.9 |
| 2020 | 331.5 | 93.9 |
| 2021 | 332.0 | 94.0 |
| 2022 | 333.3 | 94.4 |
| 2023 | 334.9 | 94.8 |
| 2024 | 340.1 | 96.3 |
| 2025 | 341.8 | 96.8 |
Source: U.S. Census Bureau, Vintage 2025 National Population Estimates.
The most notable development in this recent window is the sharp jump between 2023 and 2024, when the population grew by roughly 1.0 percent, its fastest annual growth rate since 2006, driven mainly by higher net international migration. Growth then slowed considerably between 2024 and 2025, adding only about 1.8 million people, a 0.5 percent increase, and the slowest pace since the early years of the COVID-19 pandemic. This slowdown was largely due to a sharp decline in net international migration, which fell from 2.7 million to 1.3 million over that period.
Current USA Population Density Snapshot (2026)
As of the most recent official estimate, the resident population of the United States stands at approximately 341.8 million people, translating to a national density of about 96.8 persons per square mile. This figure represents the average across the entire country and hides considerable regional contrast.
Key facts about current density distribution:
- The Northeast remains the most densely populated Census region, anchored by states such as New Jersey and Rhode Island, which rank among the most crowded in the nation.
- New Jersey holds the position of the most densely populated state, with a density exceeding 1,200 persons per square mile.
- Alaska remains the least densely populated state, with a density close to 1 person per square mile.
- Roughly two out of every three Americans live within 100 miles of a coastline, a pattern that has held for decades.
- Population growth over the past several years has increasingly favored the South and West, while the Northeast and Midwest have grown more slowly or, in some states, declined.
- Rural counties lost population between 2010 and 2020, while metropolitan and suburban areas gained tens of millions of residents, a trend that continued into the current decade with renewed growth in small towns and outlying counties.
Future Population Density Projections (2030 to 2100)
Long-range population projections come from two primary sources used in this analysis: the University of Virginia’s Weldon Cooper Center for Public Service, which produces state-benchmarked projections for 2030, 2040, and 2050, and the U.S. Census Bureau’s own 2023 National Population Projections main series, which extends estimates through the year 2100. Both sources agree that population growth will continue but at a progressively slower pace, with the Census Bureau’s main series projecting that the national population will eventually peak and begin a slow decline in the second half of the century.
| Projected Year | Projected Population (millions) | Projected Density (persons per sq mile) | Source |
|---|---|---|---|
| 2030 | 349.0 | 98.8 | Weldon Cooper Center, 2024 vintage |
| 2050 | 371.0 | 105.1 | Weldon Cooper Center, 2024 vintage |
| 2080 (peak) | 370.0 | 104.8 | U.S. Census Bureau, 2023 main series |
| 2100 | 366.0 | 103.7 | U.S. Census Bureau, 2023 main series |
Notable projected developments include:
- The year 2030 marks a demographic turning point, as older adults are projected to outnumber children in the United States for the first time in the nation’s history.
- By 2030, roughly one in five Americans, more than 70 million people, are expected to be age 65 or older.
- The national population is projected to keep expanding through about 2080, reaching close to 370 million, before beginning a gradual decline toward 366 million by the year 2100.
- Slower fertility rates and reduced net international migration are the primary drivers behind this projected deceleration and eventual decline.
- Even at its projected peak, national density is expected to remain under 105 persons per square mile, still modest by global standards.
Complete Historical to Future Population Density Table (1900 to 2100)
The table below combines historical, recent, current, and projected figures into a single continuous view spanning two centuries of change.
| Year | Population (millions) | Population Density (persons per sq mile) | Data Type |
|---|---|---|---|
| 1900 | 76.2 | 25.6 | Historical (Census) |
| 1950 | 151.3 | 50.7 | Historical (Census) |
| 1980 | 226.5 | 64.0 | Historical (Census) |
| 2000 | 281.4 | 79.6 | Historical (Census) |
| 2010 | 308.7 | 87.4 | Historical (Census) |
| 2020 | 331.4 | 93.8 | Historical (Census) |
| 2025 | 341.8 | 96.8 | Current (Estimate) |
| 2030 | 349.0 | 98.8 | Projected |
| 2050 | 371.0 | 105.1 | Projected |
| 2080 | 370.0 | 104.8 | Projected (Peak) |
| 2100 | 366.0 | 103.7 | Projected |
This combined view shows that density growth, while consistent for over a century, is expected to flatten and then reverse slightly by the end of the century, a marked departure from the steady upward climb seen throughout the 1900s.
Regional and State-Level Density Variation
National averages provide a useful benchmark, but density patterns vary enormously by region and state. A few illustrative points:
- Northeastern states such as New Jersey, Rhode Island, Massachusetts, and Connecticut consistently rank at the top of state density tables, often exceeding 800 persons per square mile.
- Western and mountain states such as Wyoming, Montana, and Alaska remain among the least dense, frequently under 10 persons per square mile.
- Southern states, particularly Texas, Florida, and Georgia, have posted some of the fastest population growth rates in recent years, gradually raising their density levels.
- Major metropolitan areas, including New York City, can reach tens of thousands of persons per square mile at the city level, far exceeding any statewide average.
- The Midwest shows a mixed pattern, with dense urban centers such as Chicago contrasted against large stretches of low-density farmland.
Recommended Articles: USA Population & Governance Policies
- USA’s Changing Religious Landscape: Christians, Atheists and Other Faiths
- USA Population Growth Rate: The Demographic Shift Reshaping America’s Future
- USA Population by Race: Historical Trends, Current Data, and Future Projections
- USA vs China Population: The Demographic Battle Shaping the 21st Century
- US Population by Ethnicity: 1980 to 2060 Trends and Projections
- US Population by Age Group: When Will Seniors Outnumber Children?
- US Life Expectancy by Year: A Century of Change and What the Future Holds
- US Male and Female Population by Year: Historical Data and 2060 Forecast
Key Drivers Behind Changing Population Density
Several structural forces explain both the historical rise in density and the anticipated slowdown ahead:
- Natural increase: Births minus deaths contributed heavily to density growth for most of the twentieth century, though this component has shrunk substantially as fertility rates declined.
- Net international migration: Immigration has become an increasingly important driver of overall population change, particularly since 2021, even as recent estimates show sharp year-to-year swings in migration volume.
- Aging population: A growing share of residents aged 65 and older, combined with fewer births, reduces the pace of natural increase and will eventually contribute to population decline in the projection period.
- Urbanization and domestic migration: Movement toward the South and West, and more recently toward smaller towns and outlying counties, continues to reshape where density increases are concentrated.
- Fixed land area: Since 1959, the total land area of the United States has remained essentially constant, meaning that all future density change will be driven entirely by population change rather than shifts in territory.
Closing Analysis
The trajectory of the United States population density reflects more than a century of demographic transformation, from a rapidly expanding frontier nation to a mature, slower-growing society. Historical Census data confirms steady density growth through every decade from 1900 to 2020, while recent annual estimates show that growth has become increasingly sensitive to shifts in international migration policy. Looking ahead, official projections point to continued but decelerating growth through the 2070s, followed by a gradual plateau and modest decline by the century’s end.
For planners, businesses, and researchers, these figures underscore a central theme: the United States will remain a comparatively low-density nation on a global scale, even as its population approaches and likely exceeds 370 million people in the decades to come.
Frequently Asked Questions
What is the current population density of the United States?
The United States has an estimated population density of about 96.8 persons per square mile as of 2025, based on a resident population of roughly 341.8 million and a total land area of 3,531,905 square miles.
How has the US population density changed since 1900?
Population density rose from about 25.6 persons per square mile in 1900 to 93.8 persons per square mile in 2020, an increase of more than 260 percent over twelve decades.
Which US state has the highest population density?
New Jersey holds the highest population density among US states, exceeding 1,200 persons per square mile, followed closely by Rhode Island and Massachusetts.
Which US state has the lowest population density?
Alaska has the lowest population density of any state, at close to 1 person per square mile, owing to its enormous land area and comparatively small population.
Will the US population density keep rising in the future?
Population density is projected to keep rising through roughly 2080, reaching close to 105 persons per square mile, before edging downward slightly toward 103.7 persons per square mile by 2100 as fertility rates decline and net migration levels moderate.
Recommended Articles: US Population by Years





