
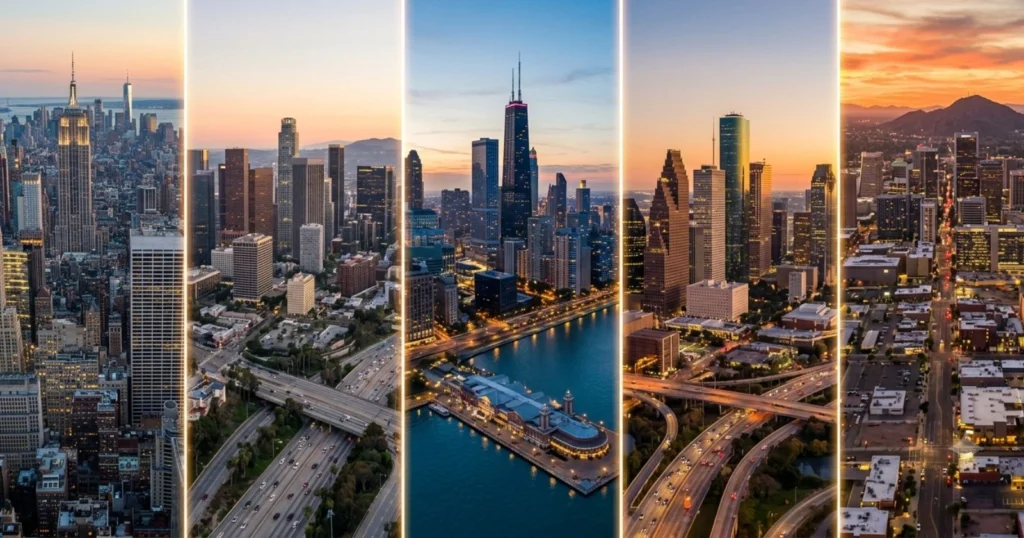
The population map of the United States has shifted dramatically over the past seven decades. Cities that once dominated the national landscape have slowed or declined, while a new generation of Sun Belt metros has surged ahead. Understanding how the largest cities in the United States have grown, and where they are headed, offers a clear picture of the country’s demographic and economic direction.
This article reviews the historical population trends of America’s largest cities, presents the most recent Census Bureau figures, and outlines future projections through 2050. It also includes a combined long-range table showing how city rankings have shifted from the mid-20th century to today, and where they may stand in the decades ahead.
Why City Population Rankings Matter
City population figures are more than a headcount. They shape federal funding formulas, congressional representation, infrastructure planning, and business investment decisions. A rising population usually signals job growth, housing demand, and expanding tax revenue, while a shrinking population often points to economic stagnation or migration to lower-cost regions.
Over the last 75 years, the story of American cities has largely been one of two competing forces:
- The decline of older, dense, industrial cities in the Northeast and Midwest, often called the Rust Belt
- The rise of car-friendly, low-tax, high-growth metros across the South and West, often called the Sun Belt
These forces continue to reshape the country’s largest cities today.
Historical Population Trends: 1950 to 2020
New York City has held the title of the largest U.S. city since the first census in 1790, and it remains unchallenged at the top. Los Angeles and Chicago have held the second and third spots for decades, though the gap between them and the fast-growing cities of Texas and Arizona has narrowed considerably.
The table below tracks population figures for the ten cities that rank among the largest in the country today, shown at 30 to 40-year intervals from 1950 through 2020. Figures are based on U.S. Decennial Census data.
Past Trends (1950–2020)
| # | City | State | 1950 | 1980 | 2000 | 2010 | 2020 |
|---|---|---|---|---|---|---|---|
| 1 | New York | NY | 7,891,957 | 7,071,639 | 8,008,278 | 8,175,133 | 8,804,190 |
| 2 | Los Angeles | CA | 1,970,358 | 2,966,850 | 3,694,820 | 3,792,621 | 3,898,747 |
| 3 | Chicago | IL | 3,620,962 | 3,005,072 | 2,896,016 | 2,695,598 | 2,746,388 |
| 4 | Houston | TX | 596,163 | 1,595,138 | 1,953,631 | 2,099,451 | 2,304,580 |
| 5 | Phoenix | AZ | 106,818 | 789,704 | 1,321,045 | 1,445,632 | 1,608,139 |
| 6 | Philadelphia | PA | 2,071,605 | 1,688,210 | 1,517,550 | 1,526,006 | 1,603,797 |
| 7 | San Antonio | TX | 408,442 | 785,940 | 1,144,646 | 1,327,407 | 1,434,625 |
| 8 | San Diego | CA | 334,387 | 875,538 | 1,223,400 | 1,307,402 | 1,386,932 |
| 9 | Dallas | TX | 434,462 | 904,078 | 1,188,580 | 1,197,816 | 1,304,379 |
| 10 | Jacksonville | FL | 204,517 | 540,920 | 735,617 | 821,784 | 949,611 |
| 11 | Fort Worth | TX | 278,778 | 385,164 | 534,694 | 741,206 | 918,915 |
| 12 | San Jose | CA | 95,280 | 629,442 | 894,943 | 945,942 | 1,013,240 |
| 13 | Austin | TX | 132,459 | 345,890 | 656,562 | 790,390 | 961,855 |
| 14 | Charlotte | NC | 134,042 | 314,447 | 540,828 | 731,424 | 874,579 |
| 15 | Columbus | OH | 375,901 | 564,871 | 711,470 | 787,033 | 905,748 |
| 16 | Indianapolis | IN | 427,173 | 700,807 | 781,870 | 820,445 | 887,642 |
| 17 | San Francisco | CA | 775,357 | 678,974 | 776,733 | 805,235 | 873,965 |
| 18 | Seattle | WA | 467,591 | 493,846 | 563,374 | 608,660 | 737,015 |
| 19 | Denver | CO | 415,786 | 492,365 | 554,636 | 600,158 | 715,522 |
| 20 | Oklahoma City | OK | 243,504 | 403,213 | 506,132 | 579,999 | 681,054 |
| 21 | Nashville | TN | 174,307 | 455,651 | 545,524 | 601,222 | 689,447 |
| 22 | Washington | DC | 802,178 | 638,333 | 572,059 | 601,723 | 689,545 |
| 23 | El Paso | TX | 130,485 | 425,259 | 563,662 | 649,121 | 678,815 |
| 24 | Las Vegas | NV | 24,624 | 164,674 | 478,434 | 583,756 | 641,903 |
| 25 | Boston | MA | 801,444 | 562,994 | 589,141 | 617,594 | 675,647 |
| 26 | Detroit | MI | 1,849,568 | 1,203,339 | 951,270 | 713,777 | 639,111 |
| 27 | Louisville | KY | 369,129 | 298,451 | 256,231 | 597,337 | 633,045 |
| 28 | Portland | OR | 373,628 | 366,383 | 529,121 | 583,776 | 652,503 |
| 29 | Memphis | TN | 396,000 | 646,356 | 650,100 | 646,889 | 633,104 |
| 30 | Baltimore | MD | 949,708 | 786,775 | 651,154 | 620,961 | 585,708 |
| 31 | Milwaukee | WI | 637,392 | 636,212 | 596,974 | 594,833 | 577,222 |
| 32 | Albuquerque | NM | 96,815 | 331,767 | 448,607 | 545,852 | 564,559 |
| 33 | Tucson | AZ | 45,454 | 330,537 | 486,699 | 520,116 | 542,629 |
| 34 | Fresno | CA | 91,669 | 218,202 | 427,652 | 494,665 | 542,107 |
| 35 | Sacramento | CA | 137,572 | 275,741 | 407,018 | 466,488 | 524,943 |
| 36 | Atlanta | GA | 331,314 | 425,022 | 416,474 | 420,003 | 498,715 |
| 37 | Mesa | AZ | 16,790 | 152,404 | 396,375 | 439,041 | 504,258 |
| 38 | Kansas City | MO | 456,622 | 448,159 | 441,545 | 459,787 | 508,090 |
| 39 | Raleigh | NC | 65,679 | 150,255 | 276,093 | 403,892 | 467,665 |
| 40 | Colorado Springs | CO | 45,472 | 215,150 | 360,890 | 416,427 | 478,961 |
| 41 | Omaha | NE | 251,117 | 314,255 | 390,007 | 408,958 | 486,051 |
| 42 | Miami | FL | 249,276 | 346,865 | 362,470 | 399,457 | 442,241 |
| 43 | Virginia Beach | VA | 5,390 | 262,199 | 425,257 | 437,994 | 459,470 |
| 44 | Long Beach | CA | 250,767 | 361,334 | 461,522 | 462,257 | 466,742 |
| 45 | Oakland | CA | 384,575 | 339,337 | 399,484 | 390,724 | 440,646 |
| 46 | Minneapolis | MN | 521,718 | 370,951 | 382,618 | 382,578 | 429,954 |
| 47 | Bakersfield | CA | 34,784 | 105,611 | 247,057 | 347,483 | 403,455 |
| 48 | Tulsa | OK | 182,740 | 360,919 | 393,049 | 391,906 | 413,066 |
| 49 | Tampa | FL | 124,681 | 271,523 | 303,447 | 335,709 | 384,959 |
| 50 | Arlington | TX | 7,692 | 160,113 | 332,969 | 365,438 | 394,266 |
Note: Louisville and Virginia Beach figures reflect city-county consolidation changes that occurred between census periods.
A few clear patterns stand out in this data:
- New York’s population dipped sharply between 1950 and 1980 during a period of urban decline, before rebounding to a new peak by 2020.
- Chicago has steadily lost population since its 1950 peak, a trend that continues today.
- Phoenix grew from a small regional city of roughly 107,000 people in 1950 to a top five U.S. city with over 1.6 million residents by 2020, one of the most dramatic transformations on this list.
- Sun Belt cities such as Houston, San Antonio, and Dallas each multiplied their populations several times over during this period, while older Northeastern and Midwestern cities grew far more slowly or shrank.
The Last 10 Years: 2015 to 2024
The most recent decade tells a more nuanced story. Growth has continued in the South and West, but it has slowed in several once fast-growing cities, while a handful of Northeastern cities that had been shrinking for years posted renewed gains after 2023. Coastal California cities, meanwhile, have faced notable population losses tied to high housing costs and remote work migration.
Last 10 Years (2015–2024)
| # | City | State | 2015 | 2020 | 2024 |
|---|---|---|---|---|---|
| 1 | New York | NY | 8,550,405 | 8,804,190 | 8,478,072 |
| 2 | Los Angeles | CA | 3,971,883 | 3,898,747 | 3,878,704 |
| 3 | Chicago | IL | 2,720,556 | 2,746,388 | 2,721,308 |
| 4 | Houston | TX | 2,296,224 | 2,304,580 | 2,390,125 |
| 5 | Phoenix | AZ | 1,563,025 | 1,608,139 | 1,673,164 |
| 6 | Philadelphia | PA | 1,567,442 | 1,603,797 | 1,573,916 |
| 7 | San Antonio | TX | 1,436,697 | 1,434,625 | 1,526,656 |
| 8 | San Diego | CA | 1,394,928 | 1,386,932 | 1,404,452 |
| 9 | Dallas | TX | 1,300,082 | 1,304,379 | 1,326,087 |
| 10 | Jacksonville | FL | 853,382 | 949,611 | 1,009,833 |
| 11 | Fort Worth | TX | 812,238 | 918,915 | 1,008,106 |
| 12 | San Jose | CA | 1,026,919 | 1,013,240 | 997,368 |
| 13 | Austin | TX | 912,791 | 961,855 | 993,588 |
| 14 | Charlotte | NC | 809,958 | 874,579 | 943,476 |
| 15 | Columbus | OH | 850,106 | 905,748 | 933,263 |
| 16 | Indianapolis | IN | 848,788 | 887,642 | 891,484 |
| 17 | San Francisco | CA | 864,816 | 873,965 | 827,526 |
| 18 | Seattle | WA | 684,451 | 737,015 | 780,995 |
| 19 | Denver | CO | 682,545 | 715,522 | 729,019 |
| 20 | Oklahoma City | OK | 631,346 | 681,054 | 712,919 |
| 21 | Nashville | TN | 654,610 | 689,447 | 704,963 |
| 22 | Washington | DC | 672,228 | 689,545 | 702,250 |
| 23 | El Paso | TX | 683,080 | 678,815 | 681,723 |
| 24 | Las Vegas | NV | 613,599 | 641,903 | 678,922 |
| 25 | Boston | MA | 655,884 | 675,647 | 673,458 |
| 26 | Detroit | MI | 677,116 | 639,111 | 645,705 |
| 27 | Louisville | KY | 615,366 | 633,045 | 640,796 |
| 28 | Portland | OR | 622,527 | 652,503 | 635,749 |
| 29 | Memphis | TN | 656,861 | 633,104 | 610,919 |
| 30 | Baltimore | MD | 623,512 | 585,708 | 568,271 |
| 31 | Milwaukee | WI | 599,164 | 577,222 | 563,531 |
| 32 | Albuquerque | NM | 559,277 | 564,559 | 560,326 |
| 33 | Tucson | AZ | 530,706 | 542,629 | 554,013 |
| 34 | Fresno | CA | 515,825 | 542,107 | 550,105 |
| 35 | Sacramento | CA | 490,712 | 524,943 | 535,798 |
| 36 | Atlanta | GA | 456,003 | 498,715 | 520,070 |
| 37 | Mesa | AZ | 464,704 | 504,258 | 517,151 |
| 38 | Kansas City | MO | 470,606 | 508,090 | 516,032 |
| 39 | Raleigh | NC | 439,896 | 467,665 | 499,825 |
| 40 | Colorado Springs | CO | 445,830 | 478,961 | 493,554 |
| 41 | Omaha | NE | 446,970 | 486,051 | 489,265 |
| 42 | Miami | FL | 441,003 | 442,241 | 487,014 |
| 43 | Virginia Beach | VA | 452,602 | 459,470 | 454,808 |
| 44 | Long Beach | CA | 474,140 | 466,742 | 450,901 |
| 45 | Oakland | CA | 419,267 | 440,646 | 443,554 |
| 46 | Minneapolis | MN | 410,939 | 429,954 | 428,579 |
| 47 | Bakersfield | CA | postponed 372,999 | 403,455 | 417,468 |
| 48 | Tulsa | OK | 403,090 | 413,066 | 415,154 |
| 49 | Tampa | FL | 352,957 | 384,959 | 414,547 |
| 50 | Arlington | TX | 386,637 | 394,266 | 403,672 |
Last 10 Years Table (2015 to 2024)
Key observations from the last decade:
- Austin has climbed into the top ten, overtaking Jacksonville and reflecting Texas’s continued dominance in high-growth metros.
- New York experienced pandemic-era population loss between 2020 and 2022, followed by a partial rebound through 2024.
- Phoenix and Houston have shown the most consistent upward trajectories among the largest cities.
- San Diego and Dallas have grown modestly but steadily, without the sharp swings seen in coastal California cities like San Francisco and Oakland.
According to the Census Bureau’s most recent Vintage 2025 estimates, this pattern has continued into 2025, with Austin, Texas, crossing the one million resident threshold for the first time, while New York City recorded a numeric population decline between 2024 and 2025 even as several of its outer suburbs grew rapidly.
Future Population Projections: 2030 to 2050
Projecting city-level population decades into the future involves inherent uncertainty, since migration patterns, housing policy, climate factors, and economic cycles can all shift unexpectedly. The figures below are forward-looking estimates based on current Census Bureau growth trends, state-level demographic projections, and municipal planning department forecasts. They should be treated as informed projections rather than guaranteed outcomes.
Future Projected Table (2030–2050)
| # | City | State | 2030 Projected | 2040 Projected | 2050 Projected |
|---|---|---|---|---|---|
| 1 | New York | NY | 8,700,000 | 8,900,000 | 9,000,000 |
| 2 | Los Angeles | CA | 3,950,000 | 4,050,000 | 4,100,000 |
| 3 | Chicago | IL | 2,650,000 | 2,550,000 | 2,450,000 |
| 4 | Houston | TX | 2,600,000 | 2,900,000 | 3,150,000 |
| 5 | Phoenix | AZ | 1,850,000 | 2,150,000 | 2,400,000 |
| 6 | Philadelphia | PA | 1,580,000 | 1,600,000 | 1,600,000 |
| 7 | San Antonio | TX | 1,700,000 | 1,950,000 | 2,150,000 |
| 8 | San Diego | CA | 1,450,000 | 1,520,000 | 1,570,000 |
| 9 | Dallas | TX | 1,400,000 | 1,550,000 | 1,700,000 |
| 10 | Jacksonville | FL | 1,100,000 | 1,250,000 | 1,400,000 |
| 11 | Fort Worth | TX | 1,100,000 | 1,300,000 | 1,500,000 |
| 12 | San Jose | CA | 1,010,000 | 1,040,000 | 1,060,000 |
| 13 | Austin | TX | 1,150,000 | 1,400,000 | 1,600,000 |
| 14 | Charlotte | NC | 1,050,000 | 1,250,000 | 1,450,000 |
| 15 | Columbus | OH | 990,000 | 1,050,000 | 1,100,000 |
| 16 | Indianapolis | IN | 920,000 | 950,000 | 970,000 |
| 17 | San Francisco | CA | 870,000 | 900,000 | 920,000 |
| 18 | Seattle | WA | 830,000 | 890,000 | 940,000 |
| 19 | Denver | CO | 770,000 | 820,000 | 860,000 |
| 20 | Oklahoma City | OK | 760,000 | 830,000 | 890,000 |
| 21 | Nashville | TN | 750,000 | 810,000 | 860,000 |
| 22 | Washington | DC | 730,000 | 760,000 | 780,000 |
| 23 | El Paso | TX | 705,000 | 740,000 | 770,000 |
| 24 | Las Vegas | NV | 720,000 | 770,000 | 810,000 |
| 25 | Boston | MA | 690,000 | 710,000 | 720,000 |
| 26 | Detroit | MI | 630,000 | 610,000 | 590,000 |
| 27 | Louisville | KY | 655,000 | 675,000 | 690,000 |
| 28 | Portland | OR | 660,000 | 690,000 | 710,000 |
| 29 | Memphis | TN | 600,000 | 585,000 | 570,000 |
| 30 | Baltimore | MD | 555,000 | 545,000 | 535,000 |
| 31 | Milwaukee | WI | 555,000 | 545,000 | 535,000 |
| 32 | Albuquerque | NM | 570,000 | 585,000 | 600,000 |
| 33 | Tucson | AZ | 575,000 | 605,000 | 630,000 |
| 34 | Fresno | CA | 570,000 | 595,000 | 615,000 |
| 35 | Sacramento | CA | 555,000 | 580,000 | 600,000 |
| 36 | Atlanta | GA | 550,000 | 590,000 | 625,000 |
| 37 | Mesa | AZ | 540,000 | 570,000 | 595,000 |
| 38 | Kansas City | MO | 530,000 | 545,000 | 555,000 |
| 39 | Raleigh | NC | 540,000 | 600,000 | 650,000 |
| 40 | Colorado Springs | CO | 520,000 | 560,000 | 595,000 |
| 41 | Omaha | NE | 505,000 | 520,000 | 530,000 |
| 42 | Miami | FL | 520,000 | 555,000 | 585,000 |
| 43 | Virginia Beach | VA | 460,000 | 465,000 | 465,000 |
| 44 | Long Beach | CA | 450,000 | 450,000 | 450,000 |
| 45 | Oakland | CA | 450,000 | 460,000 | 470,000 |
| 46 | Minneapolis | MN | 435,000 | 440,000 | 440,000 |
| 47 | Bakersfield | CA | 435,000 | 455,000 | 470,000 |
| 48 | Tulsa | OK | 420,000 | 425,000 | 425,000 |
| 49 | Tampa | FL | 435,000 | 460,000 | 480,000 |
| 50 | Arlington | TX | 415,000 | 425,000 | 430,000 |
Several trends are likely to define the coming decades:
- New York City’s Department of City Planning has projected the city’s population could approach 9.1 million by 2030, driven mainly by natural increase and international migration, even as domestic migration to the suburbs continues.
- Texas cities, particularly Houston, San Antonio, and Austin, are expected to keep growing at a faster pace than most legacy cities, supported by lower housing costs, business-friendly policies, and steady job creation.
- Phoenix is projected to continue climbing the rankings, potentially overtaking Philadelphia and challenging Houston for the fourth-largest city position within a few decades.
- Chicago is projected to see continued gradual decline, consistent with a long-running trend of Midwestern population loss tied to slower job growth and cold-weather migration patterns.
- Coastal California cities such as Los Angeles and San Diego are expected to see slow, modest growth rather than the rapid expansion of earlier decades, largely due to high housing costs and limited land for new development.
Combined Analysis: 1950 to 2050
The table below brings together historical, current, and projected figures for the same ten cities across a full century, illustrating the complete arc of population change from the mid-20th century to the middle of this one.
| # | City | State | 1950 | 2000 | 2020 | 2024 | 2030 (Proj.) | 2050 (Proj.) |
|---|---|---|---|---|---|---|---|---|
| 1 | New York | NY | 7,891,957 | 8,008,278 | 8,804,190 | 8,478,072 | 8,700,000 | 9,000,000 |
| 2 | Los Angeles | CA | 1,970,358 | 3,694,820 | 3,898,747 | 3,878,704 | 3,950,000 | 4,100,000 |
| 3 | Chicago | IL | 3,620,962 | 2,896,016 | 2,746,388 | 2,721,308 | 2,650,000 | 2,450,000 |
| 4 | Houston | TX | 596,163 | 1,953,631 | 2,304,580 | 2,390,125 | 2,600,000 | 3,150,000 |
| 5 | Phoenix | AZ | 106,818 | 1,321,045 | 1,608,139 | 1,673,164 | 1,850,000 | 2,400,000 |
| 6 | Philadelphia | PA | 2,071,605 | 1,517,550 | 1,603,797 | 1,573,916 | 1,580,000 | 1,600,000 |
| 7 | San Antonio | TX | 408,442 | 1,144,646 | 1,434,625 | 1,526,656 | 1,700,000 | 2,150,000 |
| 8 | San Diego | CA | 334,387 | 1,223,400 | 1,386,932 | 1,404,452 | 1,450,000 | 1,570,000 |
| 9 | Dallas | TX | 434,462 | 1,188,580 | 1,304,379 | 1,326,087 | 1,400,000 | 1,700,000 |
| 10 | Jacksonville | FL | 204,517 | 735,617 | 949,611 | 1,009,833 | 1,100,000 | 1,400,000 |
| 11 | Fort Worth | TX | 278,778 | 534,694 | 918,915 | 1,008,106 | 1,100,000 | 1,500,000 |
| 12 | San Jose | CA | 95,280 | 894,943 | 1,013,240 | 997,368 | 1,010,000 | 1,060,000 |
| 13 | Austin | TX | 132,459 | 656,562 | 961,855 | 993,588 | 1,150,000 | 1,600,000 |
| 14 | Charlotte | NC | 134,042 | 540,828 | 874,579 | 943,476 | 1,050,000 | 1,450,000 |
| 15 | Columbus | OH | 375,901 | 711,470 | 905,748 | 933,263 | 990,000 | 1,100,000 |
| 16 | Indianapolis | IN | 427,173 | 781,870 | 887,642 | 891,484 | 920,000 | 970,000 |
| 17 | San Francisco | CA | 775,357 | 776,733 | 873,965 | 827,526 | 870,000 | 920,000 |
| 18 | Seattle | WA | 467,591 | 563,374 | 737,015 | 780,995 | 830,000 | 940,000 |
| 19 | Denver | CO | 415,786 | 554,636 | 715,522 | 729,019 | 770,000 | 860,000 |
| 20 | Oklahoma City | OK | 243,504 | 506,132 | 681,054 | 712,919 | 760,000 | 890,000 |
| 21 | Nashville | TN | 174,307 | 545,524 | 689,447 | 704,963 | 750,000 | 860,000 |
| 22 | Washington | DC | 802,178 | 572,059 | 689,545 | 702,250 | 730,000 | 780,000 |
| 23 | El Paso | TX | 130,485 | 563,662 | 678,815 | 681,723 | 705,000 | 770,000 |
| 24 | Las Vegas | NV | 24,624 | 478,434 | 641,903 | 678,922 | 720,000 | 810,000 |
| 25 | Boston | MA | 801,444 | 589,141 | 675,647 | 673,458 | 690,000 | 720,000 |
| 26 | Detroit | MI | 1,849,568 | 951,270 | 639,111 | 645,705 | 630,000 | 590,000 |
| 27 | Louisville | KY | 369,129 | 256,231 | 633,045 | 640,796 | 655,000 | 690,000 |
| 28 | Portland | OR | 373,628 | 529,121 | 652,503 | 635,749 | 660,000 | 710,000 |
| 29 | Memphis | TN | 396,000 | 650,100 | 633,104 | 610,919 | 600,000 | 570,000 |
| 30 | Baltimore | MD | 949,708 | 651,154 | 585,708 | 568,271 | 555,000 | 535,000 |
| 31 | Milwaukee | WI | 637,392 | 596,974 | 577,222 | 563,531 | 555,000 | 535,000 |
| 32 | Albuquerque | NM | 96,815 | 448,607 | 564,559 | 560,326 | 570,000 | 600,000 |
| 33 | Tucson | AZ | 45,454 | 486,699 | 542,629 | 554,013 | 575,000 | 630,000 |
| 34 | Fresno | CA | 91,669 | 427,652 | 542,107 | 550,105 | 570,000 | 615,000 |
| 35 | Sacramento | CA | 137,572 | 407,018 | 524,943 | 535,798 | 555,000 | 600,000 |
| 36 | Atlanta | GA | 331,314 | 416,474 | 498,715 | 520,070 | 550,000 | 625,000 |
| 37 | Mesa | AZ | 16,790 | 396,375 | 504,258 | 517,151 | 540,000 | 595,000 |
| 38 | Kansas City | MO | 456,622 | 441,545 | 508,090 | 516,032 | 530,000 | 555,000 |
| 39 | Raleigh | NC | 65,679 | 276,093 | 467,665 | 499,825 | 540,000 | 650,000 |
| 40 | Colorado Springs | CO | 45,472 | 360,890 | 478,961 | 493,554 | 520,000 | 595,000 |
| 41 | Omaha | NE | 251,117 | 390,007 | 486,051 | 489,265 | 505,000 | 530,000 |
| 42 | Miami | FL | 249,276 | 362,470 | 442,241 | 487,014 | 520,000 | 585,000 |
| 43 | Virginia Beach | VA | 5,390 | 425,257 | 459,470 | 454,808 | 460,000 | 465,000 |
| 44 | Long Beach | CA | 250,767 | 461,522 | 466,742 | 450,901 | 450,000 | 450,000 |
| 45 | Oakland | CA | 384,575 | 399,484 | 440,646 | 443,554 | 450,000 | 470,000 |
| 46 | Minneapolis | MN | 521,718 | 382,618 | 429,954 | 428,579 | 435,000 | 440,000 |
| 47 | Bakersfield | CA | 34,784 | 247,057 | 403,455 | 417,468 | 435,000 | 470,000 |
| 48 | Tulsa | OK | 182,740 | 393,049 | 413,066 | 415,154 | 420,000 | 425,000 |
| 49 | Tampa | FL | 124,681 | 303,447 | 384,959 | 414,547 | 435,000 | 480,000 |
| 50 | Arlington | TX | 7,692 | 332,969 | 394,266 | 403,672 | 415,000 | 430,000 |
This century-long view makes the underlying story easy to see. Phoenix grew more than twenty times over, Houston grew roughly four times over, and Austin transformed from a mid-sized state capital into a projected top ten U.S. city, while Chicago and Philadelphia have followed a much flatter, and in Chicago’s case, declining, trajectory.
Regional Shifts Behind the Numbers
The changing rankings among America’s largest cities reflect broader regional and economic shifts:
- The Sun Belt advantage. Warmer climates, lower-cost housing, and business-friendly tax policy have pulled residents and companies toward Texas, Arizona, and Florida for decades.
- Deindustrialization in the Midwest and Northeast. The decline of manufacturing employment hit cities like Chicago, Detroit, and Cleveland hard, contributing to sustained population loss.
- Housing affordability in coastal California. High costs of living have slowed growth in Los Angeles, San Diego, San Francisco, and Oakland, even as these metro areas remain economically strong.
- Remote work and migration patterns. The years following the pandemic accelerated migration to lower-cost, lower-density areas, a trend that has only partially reversed as of the most recent Census estimates.
- International migration. Cities like New York and Los Angeles continue to rely heavily on immigration to offset domestic outmigration to surrounding suburbs and other states.
Conclusion
The list of the largest cities in the United States has never been static, and it will continue to shift over the coming decades. New York, Los Angeles, and Chicago remain the three largest cities by a wide margin, but the fastest growth is concentrated in Sun Belt metros such as Houston, Phoenix, San Antonio, and Austin. Meanwhile, legacy industrial cities in the Midwest and Northeast face ongoing demographic headwinds.
Tracking these trends over time, from the mid-20th century snapshots through the latest Census estimates and forward-looking projections, offers a useful lens for understanding how the American population is redistributing itself, and which cities are likely to lead the country’s urban landscape in the decades ahead.
Source:
- Data sources: U.S. Census Bureau Decennial Census (1950, 1980, 2000, 2010, 2020)
- U.S. Census Bureau Population Estimates Program (Vintage 2024 and Vintage 2025), and city and state demographic planning projections.
- Future figures beyond 2025 are projections based on current growth trends and are subject to change.





