
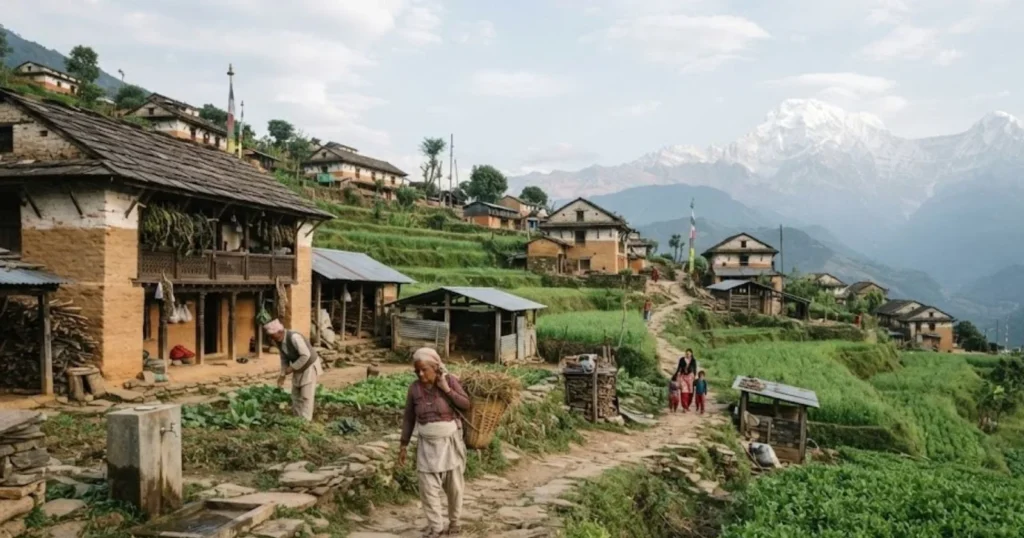
Nepal has not lost population as a country. The 2021 National Population and Housing Census counted 29,164,578 people, up from 26.5 million in 2011, with annual growth of 0.92 percent, the lowest on record. The loss is geographic. People are leaving mountain and hill villages for the Terai plains, for Kathmandu Valley and for jobs abroad, and the places they leave behind are getting older, smaller and harder to serve.
What Does Rural Depopulation Mean in Nepal?
Several concepts are often used interchangeably, but they are different.
| Concept | Definition | Example |
|---|---|---|
| Village population decline | Fewer residents counted between censuses | A ward loses 20 percent of residents in ten years |
| Net outmigration | More people leave than arrive | Young adults move to towns |
| Population aging | Rising share of older residents | Remaining residents are mostly over 50 |
| Seasonal absence | Residents away for part of the year | Migrants return for festivals and harvest |
| Complete settlement abandonment | No permanent residents | A hamlet with locked houses |
A village can have declining population without being abandoned. It can also appear stable in census counts while many adult residents are abroad, since the census records absentees separately. Distinguishing these cases matters for policy, because services needed by an aging village differ from those needed by a settlement being abandoned.
Which Parts of Nepal Are Losing Population?
Nepal’s three ecological regions show a clear pattern. The Terai now holds about 53.6 percent of the population, the hills about 40 percent and the high mountains about 6 percent. The mountain and hill regions together hold under half of the population while covering most of the land area.
News analysis of preliminary 2021 results counted 32 of Nepal’s 77 districts with negative population growth, up from 27 in the 2011 census. A geographic study using final census data identified 34 mid-hill and mountain districts with negative growth, depending on the grouping used. The difference reflects classification and data release stage, so the figure should be quoted as a range with its source.
| Region | Share of population, 2021 | Trend |
|---|---|---|
| Terai | About 53.6% | Growing share, high density in Madhesh Province |
| Hills | About 40% | Share falling, many districts shrinking |
| High mountains | About 6.1% | Smallest share, sparse settlement |
Madhesh Province holds about a fifth of the national population with the highest density, around 636 people per square kilometer. Kathmandu district recorded about 2.02 million people, while Manang district has only 5,645. District totals hide village-level variation. A district can grow because of a town while villages around it shrink, and a shrinking district can contain growing market towns.
Local examples such as hamlets in the hill districts of the western and mid-western regions illustrate depopulation, but they cannot represent all of Nepal. Claims of widespread village abandonment need direct geographic evidence at the ward level.
Why People Leave Rural Nepal
Migration decisions combine economic, social, and environmental factors. Household and migration research suggests that employment and income are the primary motives, with education, health care, and infrastructure as important supporting reasons.
| Driver | Mechanism | Evidence type |
|---|---|---|
| Employment | Few paid jobs, low farm income | Labour force and migration surveys |
| Education | Families move for better schools for children | Household studies |
| Healthcare access | Distance to hospitals | Living standards survey |
| Infrastructure | Roads, markets, electricity, connectivity | Local studies |
| Foreign labor migration | Gulf and Malaysia jobs, India work | Foreign employment data |
| Urban opportunities | Kathmandu Valley, Terai cities | Census flows |
| Family networks | Relatives abroad encourage migration | Qualitative studies |
International labor migration is large. The 2021 census recorded 2,190,592 absentees abroad, about 7.5 percent of the population, and 4,457,828 absentees in total, about 15.3 percent, which includes people away inside Nepal. Journalists and researchers note that the census figure is likely an undercount because roughly two million Nepalis are estimated to be in the Gulf alone, plus many in India and students in other countries. About 81 percent of absentees recorded are male.
Many moves are voluntary and aim at better income. Others are driven by distress, landslides, or lack of options. Treating all rural migration as forced or as harmful would not match the evidence.
How Youth Migration Changes the Population Left Behind
When young adults leave, villages keep children, women, and older residents. The census shows a sex ratio of 95.6 males per 100 females nationally and lower ratios in some districts with large male out-migration. The average household size fell from 4.88 in 2011 to 4.32 in 2021, and many households now consist of one or two older members.
The consequences include fewer workers for farm tasks, a rising share of older residents, and heavier responsibilities for women who stay. Women may manage farms, children, and elders while husbands work abroad, and they gain decision-making power in some households and face more burdens in others. Where evidence on caregiving is limited, conclusions should be cautious.
| Group left behind | Typical effect |
|---|---|
| Women | More farm and household responsibility, mixed autonomy effects |
| Older residents | Less direct family support, reliance on remittances |
| Children | Parental absence, higher dependence on grandparents |
| Remaining workers | Higher wages for scarce labor in some areas |
What Happens to Agriculture and Local Economies?
About half of Nepal’s economically active population is still mainly in agriculture, though farming contributes under a quarter of GDP. Out-migration has reduced the farm labor supply in hills and mountains. A geographic study found that national cropland share fell from 26.3 percent to 24.2 percent between 2000 and 2019, while forest cover increased in the Hill and Siwalik zones, which is consistent with land abandonment.
Migration does not necessarily cause agricultural collapse. Households use remittances to hire labor, buy inputs, switch crops, or shift to livestock and cash crops. Some land is left fallow, and some is consolidated by those who stay. Local businesses can gain from remittance spending on goods and services, while shops in shrinking hamlets lose customers.
| Effect | Mechanism | Outcome |
|---|---|---|
| Farm labor shortage | Young adults leave | Fallow land, shift to less labor-intensive crops |
| Land use change | Abandonment | Forest regrowth |
| Remittance spending | Households buy goods and construction | Boost to local trade and building |
| Local business closure | Fewer customers in small hamlets | Fewer services |
| Crop shift | Hired labor, livestock, cash crops | Variable |
Schools, Healthcare, and Public Services in Shrinking Settlements
Falling child numbers reduce school enrollment, and small schools struggle to justify teachers and facilities. Reports describe school closures and mergers in villages and even in urban areas, and teachers may be reluctant to serve in remote places. Health posts face staffing gaps and long travel distances for patients. Per capita service costs rise when residents are spread thinly across steep terrain.
| Service | Pressure | Option |
|---|---|---|
| Schools | Falling enrollment | Consolidation with transport or boarding support |
| Health posts | Staffing, drug supply | Telemedicine, mobile clinics, incentives |
| Roads | Cost of maintaining remote roads | Prioritize connecting clusters |
| Water and electricity | Small user base | Community systems |
| Local government | Smaller tax base | Fiscal transfers |
Nepal’s 2015 constitution created 753 local governments, and rural municipalities are responsible for many services. Matching service models to dispersed and declining populations is a challenge, since consolidation saves money but lengthens travel.
Who Stays and Who Goes: The Gender and Age Pattern
Out-migration in Nepal is strongly male. About 81 percent of recorded absentees are men, and most are in their twenties and thirties. This produces villages where women, children and older adults make up most of the resident population during the working year. Women’s registered land ownership has risen in some districts as families transfer titles, and women increasingly sit on local committees and cooperatives, yet they also carry the daily burden of farm work, child care and care of elders without the labor that migrants once provided.
Older residents face a different risk. Where adult children live abroad or in distant towns, support arrives mainly as money, not as daily help. Mobility problems, chronic illness and isolation are harder to manage in steep terrain with long walks to a health post.
Researchers note that the effects depend on household composition, and that a remittance-receiving household with a strong local network can be better off than a poor household with no migrants at all. Statements about left behind groups should therefore be tied to specific places and surveys, since the Nepal Living Standards Survey and local studies show wide variation by caste, ethnicity, landholding and distance from roads.
| Age group | Typical migration pattern | Local consequence |
|---|---|---|
| 15 to 24 | Study or first foreign job | Fewer young adults in village schools and clubs |
| 25 to 39 | Peak foreign labor migration | Fewer farm workers, more female-headed households |
| 40 to 59 | Return, internal move to town | Household relocation to roadside towns or the Terai |
| 60 and above | Mostly remain | Higher share of older residents, care gaps |
Remittances and the Two Sides of Migration
Remittances are a pillar of the economy. A geographic study reported that remittances amounted to about 25.9 percent of GDP, and official data showed about US$9.33 billion in fiscal year 2022 to 23, almost a quarter of GDP. Households that receive remittances typically spend on food, housing, health, education, and debt repayment, and some invest in land or small business.
Migration also has costs. Family separation, labor shortages, caregiving strain, risks to migrant workers abroad, and dependence on external demand are well documented. Household-level benefits do not translate automatically into regional development, because remittances are often spent on consumption and urban property rather than local production.
| Side | Effect |
|---|---|
| Household gains | Higher income, better schooling, reduced poverty |
| Household costs | Separation, debt for recruitment, risk abroad |
| Regional gains | Local trade, construction |
| Regional costs | Labor shortage, abandoned land, weaker services |
Can Nepal’s Empty Villages Recover?
Reversing depopulation fully is unlikely in the most remote places, and the goal in many areas is to stabilize communities and maintain services. Options include:
Rural employment: Agro-processing, cooperatives, small hydropower, and forest enterprises create local jobs, though scale is limited.
Transport and connectivity: Roads and digital access link villages to markets and services. Roads can also speed out-migration.
Service consolidation: Merging schools and clinics with transport support can maintain quality.
Tourism: Trekking and homestay tourism support livelihoods in parts of the mountains, with seasonal and uneven benefits.
Agricultural adaptation: High-value crops such as cardamom, apples, herbs, and coffee, and livestock, suit labor-constrained households.
Voluntary return migration: Returnees bring savings and skills, but studies suggest many return to towns rather than villages.
| Option | Evidence status | Limit |
|---|---|---|
| Local enterprise programs | Some positive evaluations | Small scale |
| Roads | Mixed effect on retention | Maintenance cost |
| Tourism | Beneficial where demand exists | Seasonal, concentrated |
| High value agriculture | Promising | Market access |
| Return migration incentives | Limited evidence | Few return to villages |
Distinguishing evidence-based programs from proposals needs more evaluation.
Nepal’s Rural Population Outlook
National growth is slowing and may stop within a few decades. United Nations projections show Nepal’s population peaking in the mid-century, with considerable uncertainty about migration. Mountain and hill population shares are likely to keep falling, with Terai and urban shares rising. Local projections are limited and uncertain. The next census, around 2031, will clarify trends.
| Scenario | Migration | Outcome for villages |
|---|---|---|
| High migration continues | Large labor outflow | More shrinking districts, aging |
| Moderate | Stable flows, some return | Gradual consolidation |
| Strong local development | Jobs near home | Slower loss in accessible areas |
Frequently Asked Questions
1. Why are Nepal’s villages losing population?
Limited jobs, education and services at home, and opportunities in towns, the Terai and abroad.
2. Which areas of Nepal are most affected by depopulation?
Many mid-hill and mountain districts, with 32 to 34 districts recording negative growth depending on the source.
3. Does international migration cause village abandonment?
It contributes alongside internal migration, but many migrants keep homes and return.
4. How do remittances affect rural households?
They raise income and spending but can coexist with labor shortages.
5. Can rural depopulation be reversed?
Fully reversing it is unlikely in remote areas, and strategies aim to stabilize communities and services.
6. What is Nepal’s population?
29,164,578 in the 2021 census.
7. How many Nepalis are abroad?
The census recorded 2,190,592 absentees abroad, likely an undercount.
8. How large are remittances?
About a quarter of GDP in recent years.
9. How much of the population lives in the Terai?
About 53.6 percent.
10. Are all migrants leaving involuntarily?
No. Many move for better income and opportunity.
Sources and Data Notes
- National Statistics Office, National Population and Housing Census 2021; Nepal Labour Force Survey; Nepal Living Standards Survey.
- Department of Foreign Employment; Nepal Rastra Bank remittance data.
- Peer-reviewed geography research on Nepal’s population redistribution and land use change.
- Nepali Times and Kathmandu Post reporting on census results.
- Data note: district counts of declining areas vary between sources. Verify with final census tables.