
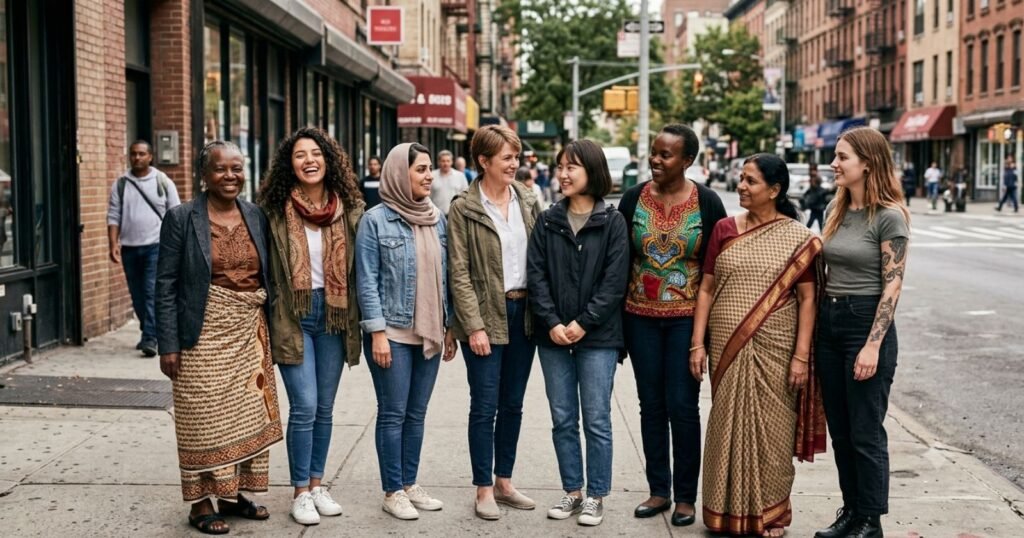
There are an estimated 4.13 billion women and girls on Earth in 2026, making up 49.74 percent of a global population of roughly 8.3 billion. That leaves a global gap of about 42.35 million more men than women, a surplus driven almost entirely by two countries, China and India, whose historical sex-selective birth patterns are large enough to tilt the entire planet’s sex ratio toward men even though most individual countries have more women than men.
That distinction, between the global aggregate and the country-level reality, is the starting point for understanding the female population. A near-balanced worldwide sex ratio conceals wide variation by age, region and migration pattern. Girls slightly outnumber boys nowhere at birth, yet women eventually outnumber men almost everywhere, because female survival advantages compound across the life course.
How Many Women Are There in the World?
The United Nations Population Division’s World Population Prospects (WPP) 2024 Revision is the standard global reference for population estimates and projections, covering 237 countries and areas from 1950 through 2100. Based on WPP 2024 trend lines carried forward, the female population in 2026 stands at approximately 4.13 billion, against 4.17 billion males, for a global sex ratio of about 101 males per 100 females.
This is a reversal of the pattern that held for most of recorded demographic history. Women outnumbered men globally as recently as 1970. The crossover to a male-majority world happened in 1971, and the male-to-female ratio has continued to widen since then, moving from 99.2 males per 100 females in 1950 to a high point near 101.4 in 2016, before stabilizing.
Three forces explain why the world flipped from female-majority to male-majority:
- Large birth cohorts in China and India during the mid-to-late 20th century, some of them affected by sex-selective practices that produced more male births than the biological norm
- A natural sex ratio at birth of roughly 105 to 107 boys per 100 girls worldwide, which favors males numerically from birth
- Faster declines in child mortality among boys in some regions, which historically died at higher rates than girls in infancy
If China and India are removed from the global count, the rest of the world has a clear female majority. That single fact does more to explain the modern global sex ratio than any other variable.
Key Facts
| Metric | Figure | Year |
|---|---|---|
| Global female population | 4.13 billion | 2026 |
| Female share of world population | 49.74% | 2026 |
| Global sex ratio | 101.0 males per 100 females | 2026 |
| Women aged 15-49 (reproductive age) | 2.0 billion | 2024 |
| Projected women aged 15-49 | 2.2 billion | late 2050s |
| Global female life expectancy at birth | approximately 76 years | 2024 |
| Global male life expectancy at birth | approximately 71 years | 2024 |
| Year the world became male-majority | 1971 | historical |
Sources: UN DESA World Population Prospects 2024 Revision; StatisticsTimes demographic projections built on UN data.
Where Do Most of the World’s Women Live?
Raw population size, not sex ratio, determines which countries hold the largest female populations. India now has the largest female population of any country, a position it took over from China as its overall population overtook China’s earlier this decade.
Largest Female Populations by Country
| Rank | Country | Female Population (approx., 2026) | Share of World’s Women |
|---|---|---|---|
| 1 | India | 715.5 million | 17.3% |
| 2 | China | 694.1 million | 16.8% |
| 3 | United States | 173.6 million | 4.2% |
| 4 | Indonesia | 143.3 million | 3.5% |
| 5 | Pakistan | 128.0 million | 3.1% |
| 6 | Nigeria | 119.7 million | 2.9% |
| 7 | Brazil | 108.6 million | 2.6% |
| 8 | Bangladesh | 90.4 million | 2.2% |
| 9 | Russia | 76.9 million | 1.9% |
| 10 | Ethiopia | 69.3 million | 1.7% |
Together, India and China alone account for roughly one in three women on Earth. That concentration means global female population trends are, in large part, a story about demographic change in South and East Asia, even when the headline statistics describe the whole world.
Absolute population size tells only part of the story. A different ranking, based on the female share of a country’s own population rather than the raw count, produces an almost entirely different list. Hong Kong has the highest female share of any territory at roughly 54.9 percent, followed by Moldova at about 54.0 percent and Macao at close to 53.9 percent. Longer female life expectancy, an aging population and labor migration patterns that draw men abroad for work all push these shares upward.
At the opposite extreme, Gulf states built around large male migrant labor forces post some of the lowest female shares recorded anywhere. Qatar’s population is only about 24 to 25 percent female because of an economy staffed heavily by male construction and service workers from South Asia and the Philippines.
The United Arab Emirates (around 31 percent female) and Oman (around 36 percent) follow a similar pattern. These are not countries with fewer women being born or living longer; they are countries whose population totals are temporarily reshaped by labor migration.
Female Population by Age
Sex ratios are not static across a lifetime. The balance between women and men shifts continuously from birth to old age, and the direction of that shift is remarkably consistent worldwide.
Girls and Young Women
At birth, boys outnumber girls almost everywhere, at a biological ratio of around 105 to 107 boys per 100 girls. In a small number of countries, primarily in East and South Asia, historical son preference pushed that ratio even higher through sex-selective abortion, though UN and WHO data show this gap narrowing in most of the affected countries over the past two decades as gender norms and enforcement have shifted.
Because male infants and children have historically faced somewhat higher mortality risk from certain causes, the numerical male advantage at birth narrows through childhood in most populations, though it rarely disappears before adulthood in countries where sex-selective practices remain a factor.
Women of Working Age
The 15 to 49 age band, commonly used to define women of reproductive age, held close to 2.0 billion women worldwide in 2024. The UN projects this figure will keep growing for another three decades, reaching approximately 2.2 billion in the late 2050s, even in scenarios where fertility keeps falling toward replacement level. This is a direct consequence of demographic momentum: large cohorts of girls born in past decades are still entering their childbearing and working years, so the reproductive-age population keeps expanding even as birth rates per woman decline.
Migration reshapes the working-age sex balance sharply in specific countries. Labor-exporting nations often see a relative rise in the resident female share as working-age men move abroad, while labor-importing economies, especially in the Gulf, see the reverse.
Older Women
Nowhere is the female demographic advantage more visible than at older ages. Because women live longer than men in virtually every country, the share of women in the population rises steadily after age 60 and becomes dominant among the oldest old. Global life expectancy at birth stood at roughly 73.3 to 73.8 years in 2024, but that headline figure masks a persistent sex gap: women’s global life expectancy is close to 76 years against roughly 71 years for men, a gap of about five years that has narrowed only slightly in the past decade as male mortality from cardiovascular disease and smoking-related illness has fallen faster than female mortality in many countries.
The gap is far from uniform. In parts of Eastern Europe, including Russia and Belarus, the female longevity advantage has historically exceeded eight to nine years, a legacy of elevated male mortality from alcohol-related causes, workplace accidents and the demographic aftershocks of the Soviet period. In a small number of countries, including Afghanistan and Nigeria in some estimates, the gap narrows or reverses because of elevated maternal mortality risk for women, which is why the female survival advantage cannot be assumed to be universal or automatic.
Why Is the Female and Male Balance Different Across Countries?
No single factor explains the variation in national sex ratios. Four mechanisms interact differently in every country:
- Sex ratio at birth. A natural surplus of male births is universal, but the size of that surplus has historically been amplified in specific countries by sex-selective practices, most notably in parts of China and India, though both countries have reported narrowing ratios in the most recent data.
- Mortality differences. Women’s biological and behavioral survival advantages compound over a lifetime, widening the female share of the population at each successive age group.
- Migration. Labor migration is the single largest driver of extreme sex ratios seen today. Gulf states import male labor at a scale that mechanically suppresses their resident female share, while some origin countries see the opposite effect.
- Conflict and historical shocks. Wars and mass male mortality events, most visibly World War II in the Soviet Union, can depress a country’s male population for generations, an effect still measurable in Russia’s demographic structure today.
How the Global Female Population Has Changed Over Time
In 1950, the world held close to 1.25 billion females out of a global population of roughly 2.5 billion, a share close to parity but tilted marginally female. Sustained population growth across the second half of the 20th century, concentrated in countries with elevated male birth ratios, pushed the world into male-majority territory by 1971. Since then, absolute female population has more than tripled even as its share of the total has settled in the 49.7 to 49.8 percent range.
Historical Female Population Snapshot
| Year | Approx. Global Female Population | Female Share of Total | Context |
|---|---|---|---|
| 1950 | 1.25 billion | ~50.4% | Pre-crossover, female-majority world |
| 1971 | ~1.90 billion | ~49.8% | Crossover year; world becomes male-majority |
| 1990 | ~2.65 billion | ~49.7% | Fertility above 3.3 births per woman globally |
| 2000 | ~3.01 billion | ~49.7% | Global sex ratio near 101.5 |
| 2024 | ~4.07 billion | ~49.7% | Fertility down to 2.3 births per woman |
| 2026 | ~4.13 billion | 49.74% | Current estimate |
The female share of the global population has been remarkably stable, within half a percentage point, for more than 50 years. What has changed dramatically underneath that stability is the age structure: a shrinking share of young girls, a growing share of working-age women, and a rapidly expanding share of women over 65.
Women and the Future of Global Demography
WPP 2024 projects global population growth to continue for several more decades before peaking later this century, with an 80 percent probability that the peak occurs within the current century. Women’s demographic trajectory is central to that trend, since the size of the reproductive-age female population, not just the fertility rate per woman, determines how many births occur globally.
The UN projects that women aged 15 to 49 will number around 2.2 billion by the late 2050s, even as global fertility continues its long decline from 3.3 births per woman in 1990 to 2.3 in 2024. Beyond 2050, projections extending to 2100 anticipate the global sex ratio gradually reversing again: StatisticsTimes’ analysis of UN trend data suggests women could outnumber men globally again by around 2088, as population growth slows in the countries currently driving the male surplus and population aging, which favors women, becomes the dominant force shaping the global sex ratio.
These are projections, not certainties. UN population projections are built on assumptions about future fertility, mortality and migration trends that can shift with policy change, economic conditions or public health developments. The medium-variant projection is the UN’s central scenario, but the agency also publishes higher and lower variants that show a meaningfully different range of outcomes by 2100.
What the Changing Female Population Means
An aging, increasingly female-majority older population has direct implications for healthcare systems, which must plan for a growing cohort of women in their 70s, 80s and 90s who typically require more years of chronic care than men, even though men face higher mortality risk at younger ages. Pension and social protection systems built around historical male-dominated workforces face pressure to adapt as women’s labor force participation rises in most regions and as widowhood becomes an increasingly common late-life experience, given the persistent female longevity advantage.
At the same time, the growing but still-peaking cohort of reproductive-age women, projected to reach 2.2 billion by the late 2050s, means global population growth has more built-in momentum than current fertility rates alone would suggest. Countries with young, still-growing female populations, concentrated in Sub-Saharan Africa and parts of South Asia, face very different planning needs than countries where the female population is already aging rapidly, such as Japan, South Korea and much of Europe.
Frequently Asked Questions
1. How many women are there in the world?
Approximately 4.13 billion, based on UN WPP 2024 trend data carried forward to 2026, representing 49.74 percent of the global population of about 8.3 billion.
2. What percentage of the world’s population is female?
Roughly 49.74 percent as of 2026. The share has stayed within a narrow half-percentage-point band since the 1970s.
3. Which country has the largest female population?
India, with an estimated 715.5 million women and girls in 2026, followed closely by China at approximately 694.1 million.
4. Which country has the highest percentage of women?
Hong Kong, at approximately 54.9 percent female, followed by Moldova (about 54.0 percent) and Macao (about 53.9 percent), largely because of longer female life expectancy and migration patterns that draw men elsewhere for work.
5. Which country has the lowest percentage of women?
Qatar, where women make up only about 24 to 25 percent of the population because of a very large male migrant labor force, followed by the United Arab Emirates and Oman.
6. Why are there more men than women globally if most countries have more women?
Because China and India, the world’s two most populous countries, have historically had more males than females, and their scale is large enough to outweigh the female majorities recorded in most other countries.
7. Why are there more women among older people?
Women live longer than men in nearly every country, a global gap of roughly five years in life expectancy at birth as of 2024, so women make up an increasing share of the population at each successive older age group.
8. How many women are of reproductive age worldwide?
About 2.0 billion women were aged 15 to 49 in 2024, a figure the UN projects will grow to approximately 2.2 billion by the late 2050s.
9. When did the world stop having more women than men?
Around 1971, when rapid population growth in male-majority countries, chiefly China and India, pushed the global sex ratio past parity for the first time in the modern demographic record.
10. Will women outnumber men globally again in the future?
UN-based projections suggest a possible return to a female-majority world by around 2088, as population aging and slower growth in the countries currently driving the male surplus shift the balance back, though this remains a projection rather than a certainty.
Sources
- United Nations Department of Economic and Social Affairs, Population Division, World Population Prospects 2024 Revision, Summary of Results
- United Nations Population Fund, World Population Dashboard, 2025-2026 data releases
- StatisticsTimes.com, World Sex Ratio 2026 and World Demographics 2026, built on UN Population Division data
- Our World in Data, “Why Do Women Live Longer Than Men,” life expectancy by sex series
- Population Reference Bureau, gender gap in life expectancy analysis
- World Bank, Population, female (% of total population), based on UN World Population Prospects
- Visual Capitalist, Countries With the Highest Percentage of Female Population, World Bank data compilation





