
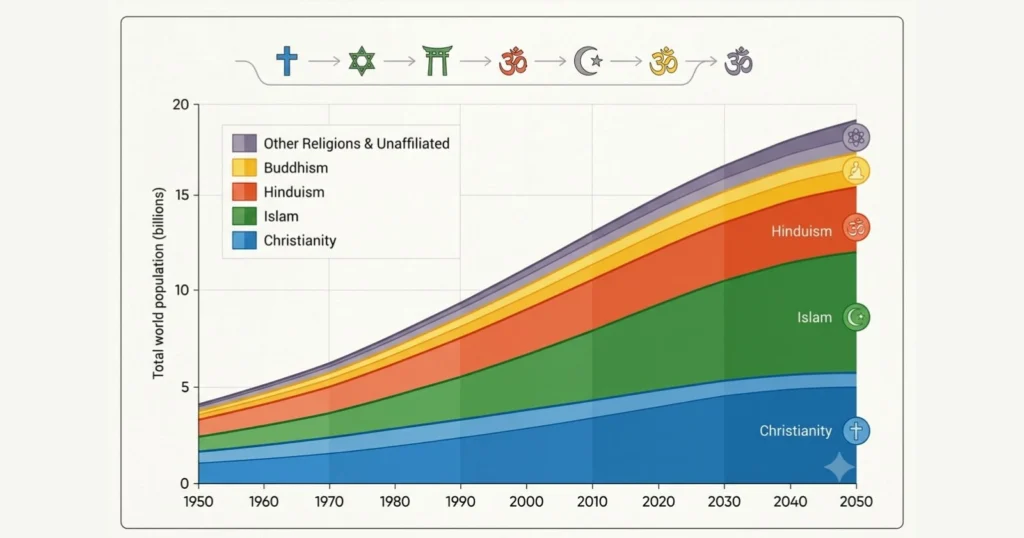
Religion remains one of the most powerful forces shaping human identity, culture, and demographic change. Since the mid-twentieth century, the religious makeup of the world has shifted dramatically, driven by differences in fertility rates, life expectancy, migration, and religious switching.
A Quick Overview of the Eight Major Religious Groups
Most demographic research on world religion sorts the global population into eight broad categories:
- Christians, the largest group and the most geographically dispersed
- Muslims, the fastest-growing major religion by percentage
- The religiously unaffiliated, sometimes called “nones,” including atheists and agnostics
- Hindus, concentrated overwhelmingly in South Asia
- Buddhists, concentrated in East and Southeast Asia
- Adherents of folk or traditional religions, including African traditional religions and Chinese folk religion
- Jews, the smallest major group by global population
- Adherents of other religions, a catch-all category covering smaller faiths such as the Baha’i faith, Jainism, Sikhism, Shintoism, and Zoroastrianism
World Population by Religion Past Trends, 1950 to 2000
The mid-twentieth century world looked very different from today. The global population stood at roughly 2.5 billion in 1950 and grew to just over 6 billion by 2000. Religious affiliation during this period was shaped heavily by decolonization, the spread of communism in parts of Asia and Eastern Europe, and rapid population growth in the developing world.
Christianity held a fairly stable share of the world’s population across these five decades, even as its center of gravity shifted away from Europe and North America toward Africa and Latin America. Islam grew steadily as a share of world population thanks to consistently high fertility rates across the Middle East, North Africa, and South Asia.
Hinduism remained tightly concentrated in India and Nepal. The religiously unaffiliated category, meanwhile, was extremely small in 1950 but expanded quickly after 1970 as secularization took hold in parts of Europe and as the officially atheist policies of the Soviet Union and Communist China suppressed religious identification in the world’s two most populous countries.
| Year | World Population (approx) | Christianity | Islam | Hinduism | Buddhism | Folk Religions | Unaffiliated | Other Religions (incl. Judaism) |
|---|---|---|---|---|---|---|---|---|
| 1950 | 2.5 billion | 34% | 15% | 12% | 9% | 13% | 1% | 16% |
| 1970 | 3.7 billion | 33% | 16% | 13% | 8% | 10% | 4% | 16% |
| 1990 | 5.3 billion | 33% | 19% | 13% | 6% | 8% | 12% | 9% |
| 2000 | 6.1 billion | 32% | 21% | 14% | 7% | 6% | 15% | 5% |
Notes on this table. Figures for 1950 and 1970 are rounded estimates drawn from long-run historical reconstructions used by demographers of religion, since global survey coverage was far thinner before 1970. The sharp rise in the unaffiliated share between 1970 and 2000 reflects improved data collection in China following economic reforms, where hundreds of millions of people report no religious affiliation, rather than a sudden wave of secularization. Category boundaries also shifted over time as researchers refined how they classified folk and traditional religions.
Key Takeaways from the Past Trends Table
- Christianity’s global share was remarkably stable across the second half of the twentieth century, generally holding between 32 and 34 percent even as its regional distribution changed enormously.
- Islam’s share rose steadily and consistently, gaining roughly six percentage points of global population between 1950 and 2000.
- The unaffiliated category grew faster than any other group in percentage terms during this period, almost entirely because of demographic data becoming available for China.
- Folk and traditional religions declined sharply as a share of world population as urbanization, formal education, and the growth of organized religions reduced their relative size, even where absolute numbers of adherents remained significant.
World Population by Religion in the Last 10 Years, 2015 to 2025
The most recent decade offers the clearest and best documented picture of religious change anywhere in this article, thanks to Pew Research Center’s 2010 and 2020 benchmark studies plus updated estimates through the mid 2020s.
Between 2015 and 2025, the global population grew from roughly 7.3 billion to more than 8.2 billion. Over this period, Muslims became the fastest-growing major religious group in both absolute and percentage terms, gaining more people between 2010 and 2020 than all other religious groups combined.
Christians remained the largest group in absolute numbers, but their share of world population continued to edge downward. The unaffiliated population also grew as a share of the total, driven mainly by patterns in China and, separately, by rising secularization in parts of Europe, North America, and Latin America. Buddhism was the only major group to shrink in absolute numbers over the decade, a trend linked to low fertility and an aging population base in East Asia.
| Year | Christians | Muslims | Unaffiliated | Hindus | Buddhists | Folk Religions | Jews | Other Religions |
|---|---|---|---|---|---|---|---|---|
| 2015 | 31.2% | 24.1% | 16.4% | 15.0% | 6.9% | 5.7% | 0.2% | 0.8% |
| 2020 | 28.8% | 25.6% | 24.2% | 14.9% | 4.1% | 4.6% | 0.2% | 2.2% |
| 2025 | 32.3% | 25.2% | 21.5% | 14.8% | 4.0% | 4.5% | 0.2% | 2.1% |
Notes on this table. The 2020 figures come from Pew Research Center’s most recent global religious landscape report, published in 2025 after accounting for census and survey delays caused by the COVID-19 pandemic. The 2025 row reflects estimates from the World Christian Database, which uses a somewhat different classification methodology than Pew, particularly around how folk religions and the unaffiliated are counted in China. Because the two major research bodies do not fully align on methodology, readers should treat cross-source comparisons as directional rather than exact.
What Changed in the Last Decade
- Muslims added roughly 347 million people between 2010 and 2020, more than the combined growth of every other religious group.
- Christians still make up the largest religious group in most countries. As of 2020, Christians formed a majority in 120 countries and territories, down slightly from 124 a decade earlier.
- The religiously unaffiliated became a majority in additional countries during this decade, including the Netherlands, Uruguay, and New Zealand, joining a group that already included China, North Korea, the Czech Republic, Hong Kong, Vietnam, Macao, and Japan.
- Buddhism was the only major religious group to see its global population decline in absolute numbers, dropping to about 324 million adherents by 2020.
- Christianity dropped below 50 percent of the population in several historically Christian majority nations, including the United Kingdom, Australia, and France.
World Population by Religion Future Projections, 2030 to 2050
Looking ahead, Pew Research Center’s demographic modeling, which incorporates fertility, mortality, migration, and religious switching for each major group, points to a narrowing gap between the world’s two largest religions. If current trends continue, the number of Muslims worldwide is expected to nearly equal the number of Christians by 2050, a milestone that would mark a first in recorded history.
Several structural factors drive these projections. Muslims currently have the highest fertility rate of any major religious group worldwide, at roughly 3.1 children per woman, compared with 2.7 for Christians and a global average of about 2.5. Muslims and Hindus also have unusually young populations, with more than a third of Muslims and nearly a third of Hindus under the age of 15 as of the most recent benchmark year, which sets up decades of future population momentum even if fertility rates continue to decline.
By contrast, the religiously unaffiliated population skews older and is heavily concentrated in low-fertility countries such as China and Japan, which is why the unaffiliated share of world population is projected to shrink even as its absolute numbers keep growing through mid-century.
| Year | Christians | Muslims | Unaffiliated | Hindus | Buddhists | Folk Religions | Jews | Other Religions |
|---|---|---|---|---|---|---|---|---|
| 2010 (baseline) | 31.4% | 23.2% | 16.4% | 15.0% | 7.1% | 5.9% | 0.2% | 0.8% |
| 2030 (projected) | 31.4% | 26.4% | 13.2% | 15.9% | 5.2% | 4.8% | 0.2% | 3.0% |
| 2050 (projected) | 31.0% | 30.0% | 13.0% | 15.0% | 5.0% | 4.8% | 0.2% | 1.0% |
Notes on this table. The 2030 row is an interpolated midpoint reflecting Pew’s stated growth trajectory for each group between 2010 and 2050, since Pew’s published report emphasizes endpoint figures for 2010 and 2050 rather than a full decade-by-decade breakdown. The 2050 figures are Pew’s headline projection: roughly 2.9 billion Christians and 2.8 billion Muslims, each representing 31 percent and 30 percent of a projected global population of about 9.3 billion.
What the Future Projections Suggest
- By 2050, Muslims are projected to make up more than 50 percent of the population in 51 countries, two more than in 2010, as Nigeria and North Macedonia are each expected to cross that threshold.
- Nigeria is projected to have the third largest Christian population of any country in the world by 2050, after the United States and Brazil, even as its Muslim population also grows substantially.
- Four out of every ten Christians in the world are expected to live in sub-Saharan Africa by 2050, compared with a much smaller share in the mid-twentieth century.
- The unaffiliated population is projected to grow in absolute numbers, adding tens of millions of people, but shrink as a share of world population because it is concentrated in slow-growing, aging regions.
- Hindus and Jews are both projected to be somewhat larger in absolute numbers by 2050 than they were in 2010, even though their global percentage shares stay roughly flat.
- The global Buddhist population is projected to remain roughly the same size in 2050 as it was in 2010, meaning its share of a larger world population will continue to shrink.
Combined Table, World Population by Religion 1950 to 2050
The table below brings together the past, current, and projected figures discussed throughout this article into a single reference table spanning a full century of religious demographic change.
| Year | World Population (approx) | Christianity | Islam | Unaffiliated | Hinduism | Buddhism | Folk Religions | Judaism and Other |
|---|---|---|---|---|---|---|---|---|
| 1950 | 2.5 billion | 34% | 15% | 1% | 12% | 9% | 13% | 16% |
| 1970 | 3.7 billion | 33% | 16% | 4% | 13% | 8% | 10% | 16% |
| 1990 | 5.3 billion | 33% | 19% | 12% | 13% | 6% | 8% | 9% |
| 2000 | 6.1 billion | 32% | 21% | 15% | 14% | 7% | 6% | 5% |
| 2010 | 6.9 billion | 31.4% | 23.2% | 16.4% | 15.0% | 7.1% | 5.9% | 1.0% |
| 2020 | 7.8 billion | 28.8% | 25.6% | 24.2% | 14.9% | 4.1% | 4.6% | 2.4% |
| 2030 (proj.) | 8.5 billion | 31.4% | 26.4% | 13.2% | 15.9% | 5.2% | 4.8% | 3.2% |
| 2050 (proj.) | 9.7 billion | 31.0% | 30.0% | 13.0% | 15.0% | 5.0% | 4.8% | 1.2% |
This long view makes several patterns easier to see. Christianity’s share of world population has been remarkably resilient across a full century, generally hovering close to one third of humanity even through enormous shifts in where Christians actually live. Islam shows the most consistent upward trajectory of any major group across the entire seventy-year window, more than doubling its share of world population from 1950 to the projected 2050 figure.
The unaffiliated category shows the most volatile pattern of any group, driven largely by data availability in China rather than a steady global trend, which is an important caveat for anyone using this figure to argue about the pace of secularization worldwide.
Regional Drivers Behind the Numbers
Religious demographic change cannot be separated from regional population trends, and a few regional stories explain most of the shifts described above.
- Sub-Saharan Africa is the fastest-growing region on earth and is a major contributor to the growth of both Christianity and Islam worldwide. High birth rates there are expected to keep driving global totals for both religions well beyond 2050.
- Asia and the Pacific region is home to the overwhelming majority of the world’s Hindus, Buddhists, and adherents of folk religions, along with roughly three-quarters of the religiously unaffiliated population. China alone is home to hundreds of millions of unaffiliated people, more than twice the total population of the United States.
- The Middle East and North Africa remain overwhelmingly Muslim, with the region continuing to see Christian communities decline as a share of the regional population due to migration and demographic pressures.
- Europe and North America are the primary regions where Christianity’s share of the population is falling fastest, driven by low fertility rates, an aging population, and rising numbers of people switching out of Christian identity toward no religious affiliation.
- Latin America and the Caribbean remain heavily Christian and are expected to stay relatively stable in terms of Christian population share through 2050, even as religious switching within Christianity, particularly growth in Evangelical and Pentecostal traditions, reshapes the region’s internal religious composition.
Fertility, Age Structure, and Religious Switching
Three demographic mechanisms explain almost all of the changes described in this article.
Fertility rates vary meaningfully across religious groups. Muslims have the highest global fertility rate among major religions, followed by Christians, while Buddhists, the unaffiliated, and adherents of other religions tend to have fertility levels below the replacement rate needed to sustain their populations over time.
Age structure compounds these fertility differences. Younger populations, such as those found among Muslims and Hindus, carry built-in momentum for future growth even if fertility rates decline, simply because a larger share of the population has not yet entered its prime childbearing years. Older populations, such as those found among Jews, Buddhists, and Christians in aging regions like Europe, face the opposite dynamic.
Religious switching, meaning people who change their religious identity over the course of their lives, plays a smaller but still meaningful role. Christianity has experienced the largest net losses from switching in recent decades, with most people who leave Christianity moving into the unaffiliated category rather than converting to another religion. Islam, by contrast, has experienced only modest net losses from switching, and the unaffiliated category has seen the largest net gains from people switching into it, primarily from Christian backgrounds in Europe, North America, and elsewhere.
Final Thoughts
The story of world population by religion from 1950 to 2050 is really a story about demography as much as belief. Fertility rates, age structures, and where people happen to be born explain far more of the century’s religious shifts than conversion or persuasion ever could.
Christianity and Islam are likely to remain the world’s two largest religions through mid-century, together accounting for roughly six in ten people on earth, while the religiously unaffiliated population, though large and growing in absolute terms, is expected to make up a shrinking share of a rapidly growing global population. Anyone trying to understand the future of religion, culture, or geopolitics over the coming decades will need to keep these underlying demographic currents firmly in view.
Frequently Asked Questions
Which religion has grown the fastest since 1950?
Islam has shown the most consistent percentage growth of any major religion since 1950, driven by high fertility rates and a young population base across the Middle East, North Africa, and South Asia.
Will Muslims outnumber Christians by 2050?
Current projections suggest Muslims will nearly equal Christians in total population by 2050, with each group representing roughly 30 to 31 percent of the world’s population, though Christianity is expected to remain narrowly the largest group at the global level.
Why did the unaffiliated population grow so quickly after 1970?
Most of the apparent growth reflects improved demographic data collection in China rather than a sudden global wave of secularization. China alone accounts for a majority of the world’s religiously unaffiliated population.
Is Buddhism shrinking?
Buddhism is the only major religious group projected to remain roughly flat in absolute population size between 2010 and 2050, largely because of low fertility rates and an aging population base concentrated in East Asia. As a share of a growing world population, this means Buddhism’s percentage is expected to continue declining.
Which region will have the most Christians by 2050?
Sub-Saharan Africa is projected to be home to about four in ten of the world’s Christians by 2050, making it the demographic center of global Christianity.
Are these projections certain to come true?
No projection of this kind is a guarantee. These figures assume that current fertility, mortality, migration, and switching patterns continue on their present trajectories. Unexpected events, policy changes, conflicts, or shifts in religious switching behavior, particularly in large countries such as China, India, or Nigeria, could meaningfully change the outcome.
The figures presented here draw primarily on the Pew Research Center, whose Global Religious Futures project is widely regarded as the most comprehensive demographic study of religion worldwide, along with supporting estimates from the World Christian Encyclopedia and the World Christian Database. Because censuses and surveys before 1970 were far less standardized across regions, early historical figures should be read as informed estimates rather than precise counts. From 2010 onward, the data reflect rigorous analysis of more than 2,500 censuses, surveys, and population registers covering roughly 95 percent of the global population.





