Every moment, lives begin and end across the globe, shifting the total count of people on Earth. Live counters, often called world population clocks, capture this dynamic reality in real time. These digital tools display a running total that climbs steadily, reflecting births, deaths, and the subtle forces driving human expansion.
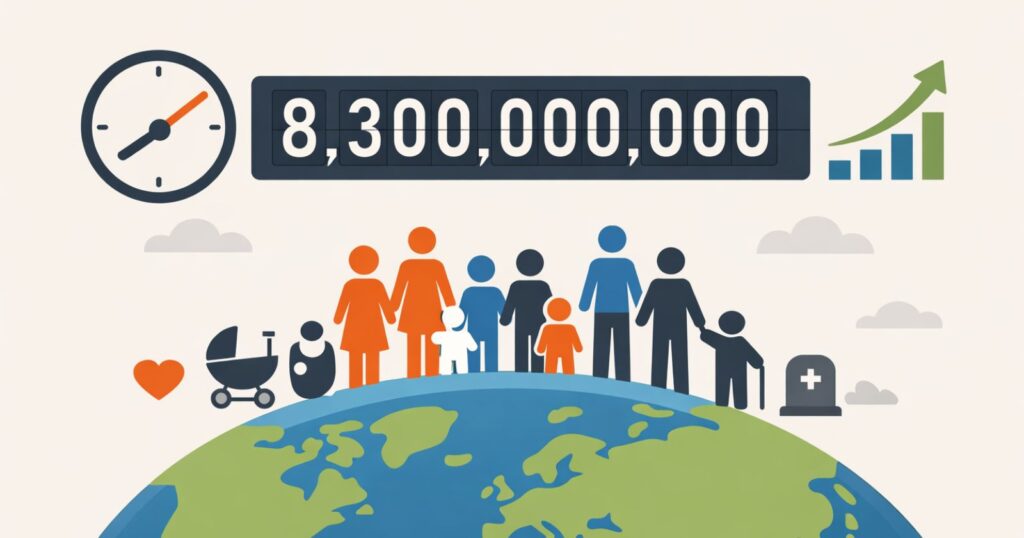
Such clocks have fascinated millions, appearing on websites, apps, and even public displays. They turn abstract statistics into something tangible, showing how the planet’s inhabitants grow by roughly two people net each second. Behind the ticking numbers lies a blend of sophisticated modeling and authoritative data, ensuring the figures remain as accurate as possible.
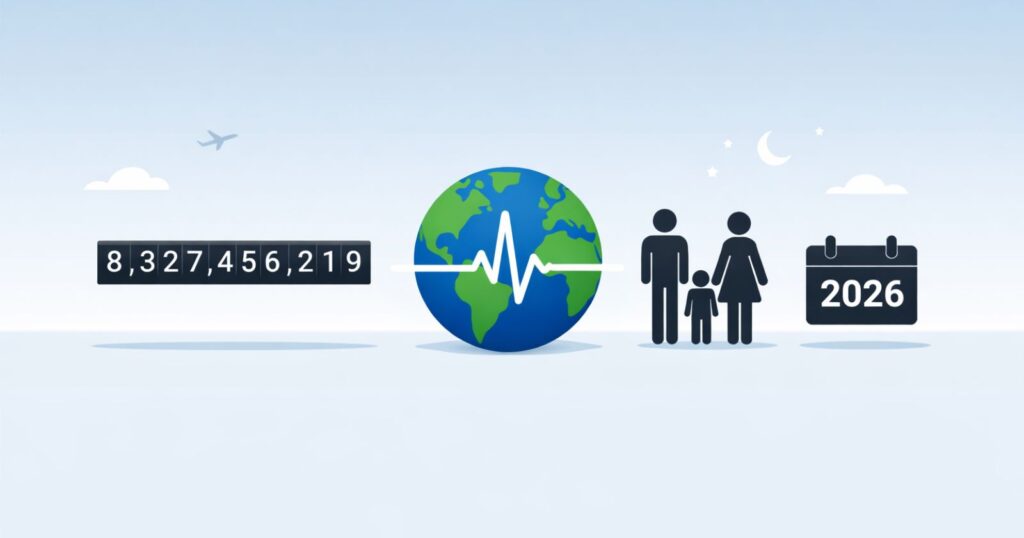
Interest in these counters surged when the world reached milestones like eight billion in late 2022. Today, in early 2026, the global total stands around 8.27 billion, continuing an upward trajectory shaped by regional differences in fertility and mortality.
What Exactly Is a World Population Clock?
Defining the Live Counter
A world population clock serves as a dynamic estimator of the current global human count. Popular versions, such as those on Worldometer or the U.S. Census Bureau site, show a number that increases continuously.
These tools do not count individual events instantly worldwide. Instead, they apply projected rates of births and deaths to a baseline figure, advancing the total in small increments.
Popular Platforms Displaying the Clock
Several trusted sites feature prominent clocks. Worldometer stands out for its detailed breakdowns, while the U.S. Census Bureau offers an official government version.
Other platforms, like Countrymeters or independent trackers, provide similar real-time views, often with country-level details.
How Often Does the Clock Update?
Real-Time Increments Explained
Most visible world population clocks refresh every second. This frequency creates the illusion of seamless growth, adding one or more people per tick based on calculated rates.
For instance, with a net gain of approximately 2.2 people per second, the display adjusts accordingly, sometimes showing fractional progress before rounding up.
Behind the Scenes: Continuous Calculation
The update happens constantly through algorithms running on servers. Each second represents an extrapolation from daily or annual growth projections.
Some sources describe this as updating 86,400 times per day, aligning perfectly with the seconds in 24 hours.
Visual vs. Data Refresh
While the on-screen number changes second by second, underlying data models receive periodic revisions. Baseline figures and rates update when new estimates become available, typically annually or biennially.
Primary Data Sources Fueling the Clock
United Nations World Population Prospects
The UN Population Division releases comprehensive revisions every two years through its World Population Prospects series. The 2024 edition provides the latest medium-variant projections used widely.
These estimates draw from national censuses, vital registration systems, and surveys across 237 countries and areas.
U.S. Census Bureau International Database
The Census Bureau maintains its own International Database, updated periodically with new demographic analyses. It offers midyear estimates and short-term projections.
Many clocks cross-reference both UN and Census data for robustness.
Other Contributing Inputs
Additional sources include World Bank datasets, national statistical offices, and academic compilations. Aggregators harmonize these for consistent global views.
| Source | Update Frequency | Key Focus | Coverage |
|---|---|---|---|
| United Nations World Population Prospects | Every 2 years (latest 2024) | Long-term projections to 2100 | 237 countries/areas, age/sex breakdowns |
| U.S. Census Bureau International Database | Periodic (multiple times per year for select countries) | Midyear estimates and components of change | Over 200 countries, vital rates |
| Worldometer Algorithm | Real-time extrapolation | Live counter visualization | Global total with daily births/deaths |
| National Censuses and Surveys | Varies by country (often decennial) | Base population counts | Country-specific raw data |
The Methodology Behind Real-Time Estimates
Starting with a Baseline
Clocks anchor to a known milestone or midyear estimate, such as the UN’s July figure for a given year.
From there, models apply daily growth rates derived from fertility, mortality, and migration components.
Applying Growth Rates
Current annual growth hovers around 0.85 percent, translating to about 70 million net additions yearly.
Divided across seconds, this yields the per-tick increment.
Accounting for Uncertainty
Exact counts remain impossible due to incomplete real-time reporting worldwide. Estimates acknowledge margins of error, especially in regions with limited vital registration.
Projections refine over time as new censuses emerge.
Historical Milestones and Current Figures
Key Population Landmarks
Humanity reached one billion around 1804, two billion in 1927, and accelerated thereafter.
The eight billion mark arrived in November 2022, per UN designation.
Today’s Global Total
As of early January 2026, estimates place the world population near 8.27 billion.
Growth continues, though at a slowing pace compared to mid-20th century peaks.
Regional Variations Driving Change
Asia hosts over 60 percent of people, led by India and China.
Africa experiences the fastest expansion, with high fertility sustaining rapid increases.
Challenges in Accurate Population Tracking
Data Gaps in Developing Regions
Many areas lack complete birth and death registration, relying on surveys and adjustments.
Conflicts or disasters further complicate counts.
Projection Adjustments Over Time
Revisions occur as better data arrives. For example, pandemic effects prompted updates in recent cycles.
Balancing Precision and Accessibility
Clocks prioritize engaging visualization while grounding in scientific estimates.
Future Projections and Peak Population
Expected Trajectory Ahead
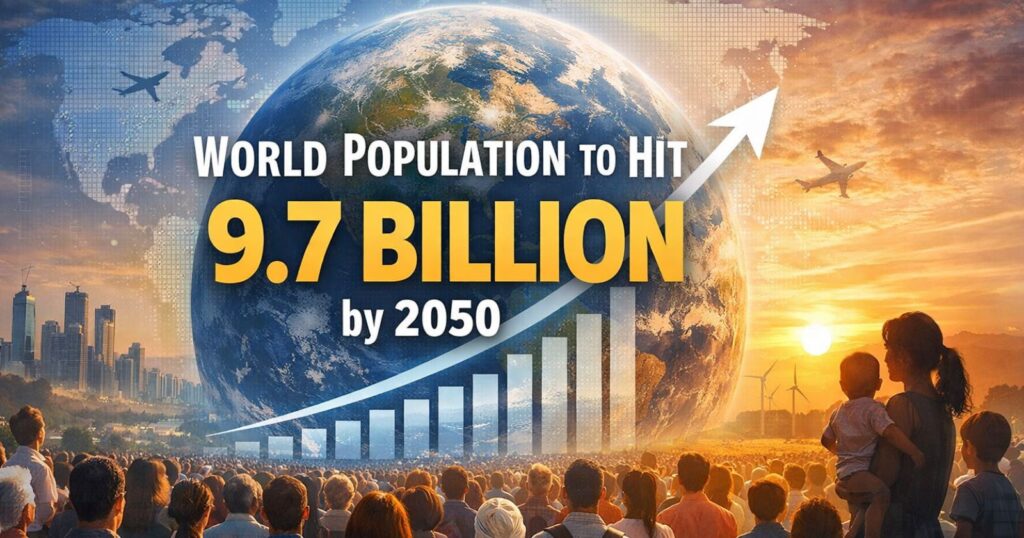
UN medium scenarios forecast around 9.7 billion by 2050 and a peak near 10.3 billion in the 2080s.
Declining fertility in most regions contributes to this slowdown.
Factors Influencing Long-Term Trends
Improvements in education, healthcare, and women’s empowerment reduce birth rates.
Urbanization and economic development also play roles.
Potential for Earlier Stabilization
Some variants suggest peaking sooner if fertility drops faster.
Why These Clocks Matter Today
Live counters raise awareness about resource demands, urbanization pressures, and aging societies.
They inform policy on sustainability, migration, and development goals.
Educators and journalists use them to illustrate demographic shifts vividly.
Key Conclusion And Analysis
These tools remind everyone of shared humanity amid constant change. Reliable estimates from institutions like the United Nations and U.S. Census Bureau ensure the numbers reflect careful analysis.
As growth moderates, focus shifts toward sustainable futures, equitable resources, and adapting to aging or expanding populations in different regions. The ticking clock continues, symbolizing both progress and the need for thoughtful planning ahead.
Frequently Asked Questions
- What is the current world population in 2026? Estimates place it around 8.27 billion as of early 2026, with ongoing growth adding millions annually.
- How does a world population clock calculate its number? It starts from a baseline estimate and adds net growth based on projected birth and death rates, applied continuously.
- Is the world population clock counting real people in real time? No, it uses mathematical extrapolation from demographic models rather than instant global event tracking.
- Which is more accurate: UN or U.S. Census Bureau estimates? Both are highly reliable, with slight differences in milestones; many tools blend them for balance.
- How often do the underlying data sources update? UN revisions occur every two years; Census Bureau updates components periodically as new information emerges.
- Why do different population clocks show slightly different numbers? Variations stem from chosen baselines, growth assumptions, and source preferences.
- What growth rate powers the second-by-second updates? Around 0.85 percent annually, equating to roughly 2.2 net additions per second.
- Can population clocks predict exact future milestones? They offer projections with variants, but uncertainty grows over longer horizons.
- How do migration and other factors affect the clock? Net migration contributes minimally globally but influences regional and national estimates.
- Will the world population ever stop growing? Projections indicate a peak in the late 21st century, followed by stabilization or slow decline under medium scenarios.