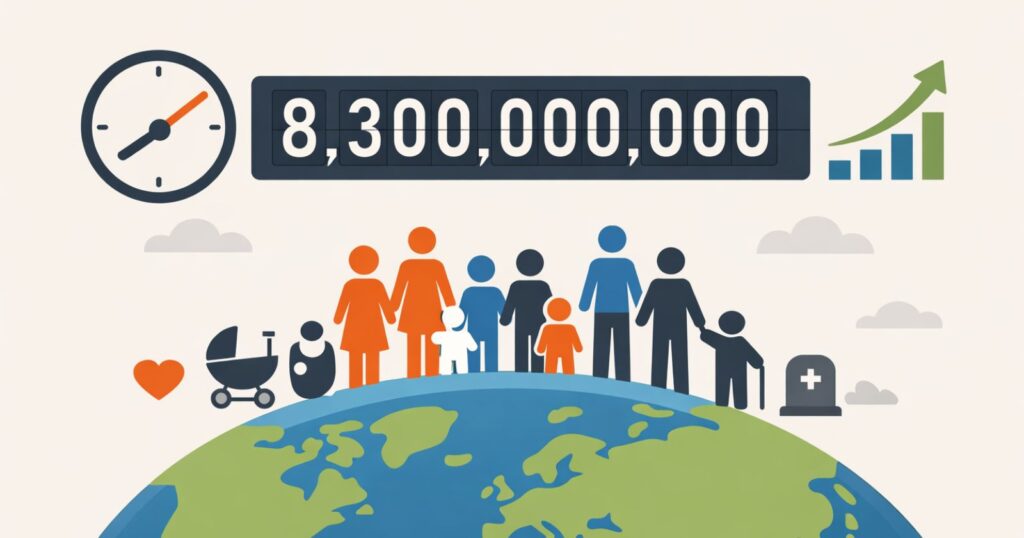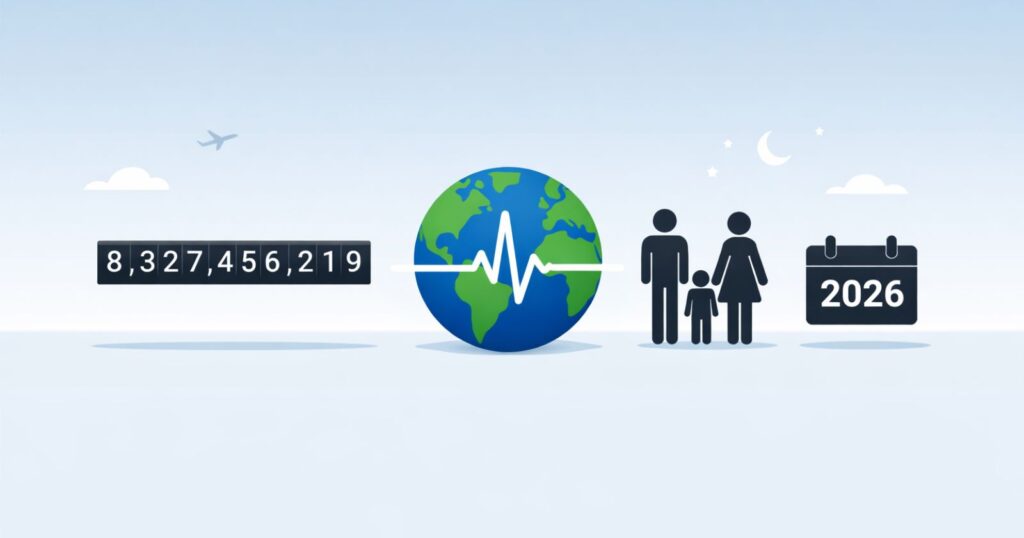
Every second, the world’s live population clock somewhere online jumps forward by a couple of numbers. That small tick represents real human events happening across the globe right now. In early 2026, the world population stands at around 8.27 billion people, and it keeps shifting constantly. These changes feel abstract until one considers what drives them: new lives beginning and others ending, all unfolding in real time.
People often notice these counters during moments of curiosity about humanity’s scale. The numbers reveal more than just growth. They highlight imbalances between regions where families welcome multiple children and others where populations age rapidly. Advances in medicine and shifts in lifestyle play roles too, creating a dynamic balance that evolves year by year.
Understanding these fluctuations matters because they influence everything from resource needs to economic planning. As the planet approaches higher totals, the pace of change slows compared to past decades, yet it remains positive for now. Exploring the core reasons behind these second-by-second adjustments offers insight into broader demographic patterns shaping the future.
Core Drivers of Constant Change
Three fundamental elements determine how population numbers move: births, deaths, and migration. At the global level, migration balances out since people leaving one place arrive elsewhere. The net worldwide effect comes almost entirely from the difference between births and deaths.
Births add to the total every moment, while deaths subtract. When births exceed deaths, the population grows. Current estimates show about 385,000 births and 173,000 deaths occurring daily. That translates to roughly four births and two deaths per second, yielding a net increase of around two people every second.
These rates vary widely by location. Sub-Saharan Africa sees higher birth numbers due to younger populations and larger family sizes. In contrast, Europe experiences more deaths than births in many countries, relying on immigration to maintain or grow totals.
Births: The Primary Addition
Births represent the most significant upward force. Globally, around 132 million babies enter the world each year. That averages to over 362,000 daily.
Fertility rates measure this trend, indicating average children per woman. The current global figure hovers around 2.3, down from higher levels in previous generations. Replacement level sits at about 2.1, meaning enough to maintain steady numbers without growth or decline.
Regions differ markedly. Parts of Africa maintain rates above 4, contributing heavily to overall increases. Asia and Latin America show declining figures as education and economic opportunities expand, especially for women. Developed nations often fall below replacement, with some at 1.5 or lower.
Healthcare improvements boost survival for mothers and infants, supporting stable birth contributions. Access to family planning allows couples to choose timing and number of children, influencing rates over time.
Deaths: The Counterbalance
Deaths offset additions, with about 63 million occurring annually worldwide. Daily, that equals roughly 173,000.
Mortality rates have dropped dramatically over decades thanks to better sanitation, vaccines, and treatments. Life expectancy now averages over 73 years globally, up significantly from mid-20th century figures.
Aging populations in certain areas increase death totals. As larger cohorts reach older ages, natural endings rise. Chronic conditions become more common factors alongside infectious diseases in lower-income settings.
Pandemics or conflicts can spike numbers temporarily, but long-term trends point downward for age-adjusted rates. Continued medical progress likely keeps pushing expectancy higher.
Migration’s Limited Global Role
Migration reshapes national populations profoundly but cancels out worldwide. Someone emigrating reduces one country’s count while boosting another’s.
Net flows tend toward urban areas and higher-income nations. Economic opportunities, safety, and climate effects drive movements. Globally, though, it contributes zero to the total headcount change.
Real-Time Statistics Behind the Ticks
Live counters use projections from bodies like the United Nations to estimate second-by-second shifts. The UN’s 2024 World Population Prospects provide the foundation, updated regularly.
| Metric | Annual Estimate | Daily Average | Per Second Approx. |
|---|---|---|---|
| Births | 132 million | 362,000 | 4.2 |
| Deaths | 63 million | 173,000 | 2.0 |
| Net Increase | 69 million | 189,000 | 2.2 |
| Growth Rate | 0.84% | – | – |
These figures come from UN medium-variant projections and similar sources. Actual events vary day to day, but averages hold steady.
Growth has slowed from peaks above 2% in the 1960s. Annual additions now fall around 70 million, expected to decline further as fertility converges lower.
Regional Variations in Action
Growth concentrates in specific areas. Asia and Africa account for most net additions currently. India, Nigeria, and Pakistan lead in absolute increases.
Africa’s youthful demographic means high birth contributions persist. Projections show the continent driving future growth as other regions stabilize or shrink.
Europe and parts of East Asia face a natural decrease, where deaths outpace births. Japan and Italy exemplify this, with populations declining in the absence of immigration.
North America maintains moderate growth through balanced rates and inflows. Latin America transitions toward lower fertility, mirroring earlier shifts elsewhere.
These differences create a mosaic where some places expand rapidly while others contract.
Historical Context and Slowing Pace
Human numbers remained low for millennia before exploding in modern eras. Industrialization, agriculture improvements, and medicine sparked rapid rises starting in the 1800s.
The total reached 1 billion around 1800, doubled by 1927, and hit 8 billion in 2022. Growth peaked mid-20th century before demographic transitions took hold.
Many countries progressed through stages: high births and deaths initially, then falling deaths with sustained births causing surges, followed by dropping births leading to stability.
Most nations now advance through later stages, explaining the global slowdown.
Influences on Fertility Choices
Multiple societal elements affect birth decisions. Education, particularly for girls, correlates strongly with smaller families.
Economic factors matter too. Higher costs of raising children in urban settings discourage larger households. Women’s workforce participation often aligns with delayed or fewer births.
Cultural norms and access to contraception shape outcomes. Government policies, from incentives to restrictions, have impacted rates in various nations historically.
Urbanization shifts lifestyles, typically reducing fertility as priorities change.
Mortality Trends and Longevity Gains
Declining deaths stem largely from conquering infectious diseases. Vaccines eradicated or controlled many threats like smallpox and polio.
Nutrition improvements and public health measures cut infant and child mortality sharply. Antibiotics and hospital care transformed outcomes for many conditions.
Aging brings new challenges, with heart disease, cancer, and dementia rising. Still, treatments advance, extending healthy years.
Disparities persist between rich and poor nations, though gaps narrow over time.
Future Outlook for Global Totals
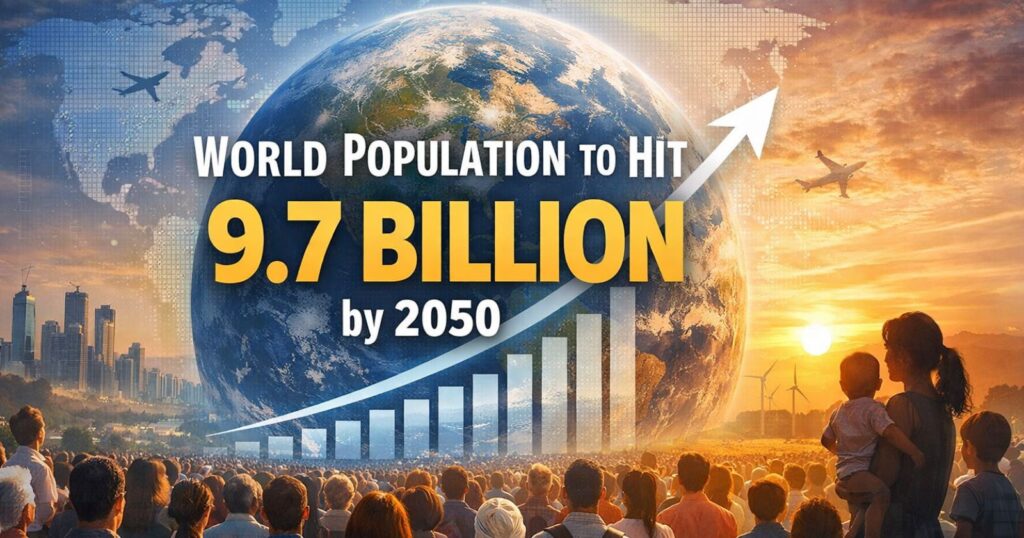
Projections suggest continued growth through mid-century, peaking around 10.3 billion in the 2080s per UN medium scenarios. After that, stability or slow decline may follow.
Lower fertility assumptions accelerate the peak, while higher ones delay it. Uncertainty surrounds exact trajectories, especially in high-growth regions.
Policy responses vary. Some countries encourage births to counter aging, while others focus on sustainable management.
Environmental pressures intersect with demographics. Resource strains intensify in growing areas, while shrinking populations face labor shortages.
Balancing Growth and Sustainability
Rapid expansions challenge infrastructure, food supply, and ecosystems. Dense urban centers highlight these issues vividly.
Conversely, aging societies strain pension and healthcare systems. Workforce reductions impact economic vitality.
Balanced approaches address education, health, and equality to navigate transitions smoothly. Empowering choices supports stable outcomes.
International cooperation aids in managing flows and sharing best practices.
The second-by-second changes reflect profound human stories: joy in new arrivals, sorrow in losses, and movements seeking better lives. These aggregate into global patterns that demand attention.
Current dynamics show a world still growing but at a moderating pace. Births continue to lead deaths, sustaining upward ticks on counters everywhere.
As trends evolve, the net addition per second may diminish further, perhaps approaching zero later this century. Until then, each moment adds to humanity’s shared total.
Appreciating these drivers fosters informed perspectives on challenges ahead. From regional imbalances to longevity gains, the factors interplay complexly yet predictably.
Ultimately, the constant flux underscores interconnectedness. Events in one corner ripple through global figures, reminding everyone of the shared demographic journey.
FAQs
- What causes the world population to increase every second? Births exceed deaths by about two people per second globally, leading to net growth.
- How many births and deaths happen worldwide each day? Approximately 362,000 births and 173,000 deaths occur daily on average.
- Why do population clocks show different numbers? They rely on varying projections from sources like the UN or national bureaus, with slight differences in base estimates and rates.
- Which regions contribute most to population growth? Africa and parts of Asia drive the majority of net increases due to higher fertility rates.
- Does migration affect the global population total? No, migration redistributes people between countries but does not change the worldwide count.
- What is the current global fertility rate? It stands at around 2.3 children per woman, varying significantly by region.
- How has the population growth rate changed over time? It peaked at over 2% in the 1960s and now sits below 1%, continuing to slow.
- When might the world population peak? UN projections point to the mid-2080s at around 10.3 billion in the medium scenario.
- Why are birth rates declining in many countries? Factors include education, urbanization, economic pressures, and access to family planning.
- How do improvements in healthcare impact population changes? They reduce deaths and raise life expectancy, initially boosting growth before fertility adjusts downward.