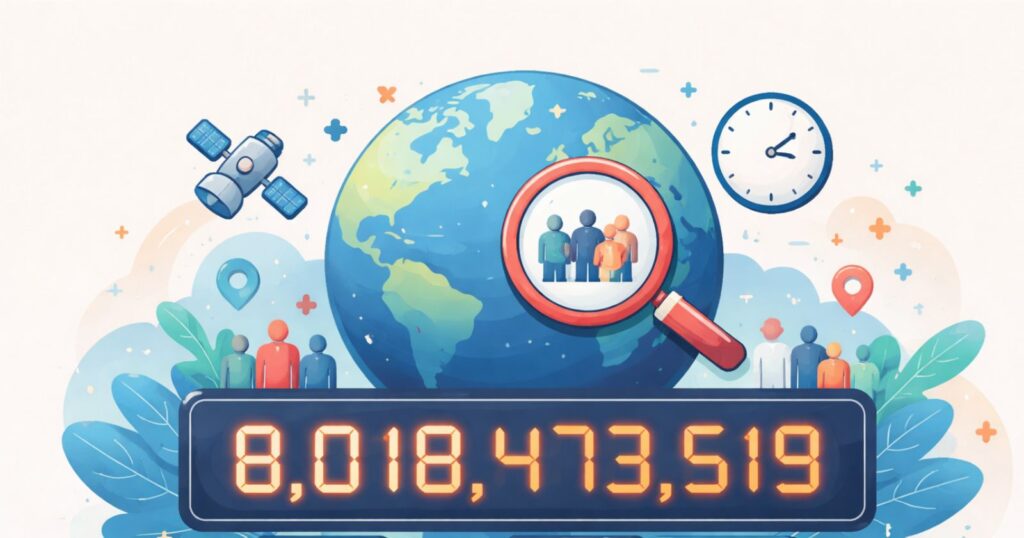
Every day, billions of people go about their lives across the planet, from bustling cities to remote villages. Behind the scenes, demographers work tirelessly to count them all, even though no one can pinpoint the exact number at any given moment. That is where the world population clock comes in, offering a fascinating glimpse into humanity’s ever-changing total.
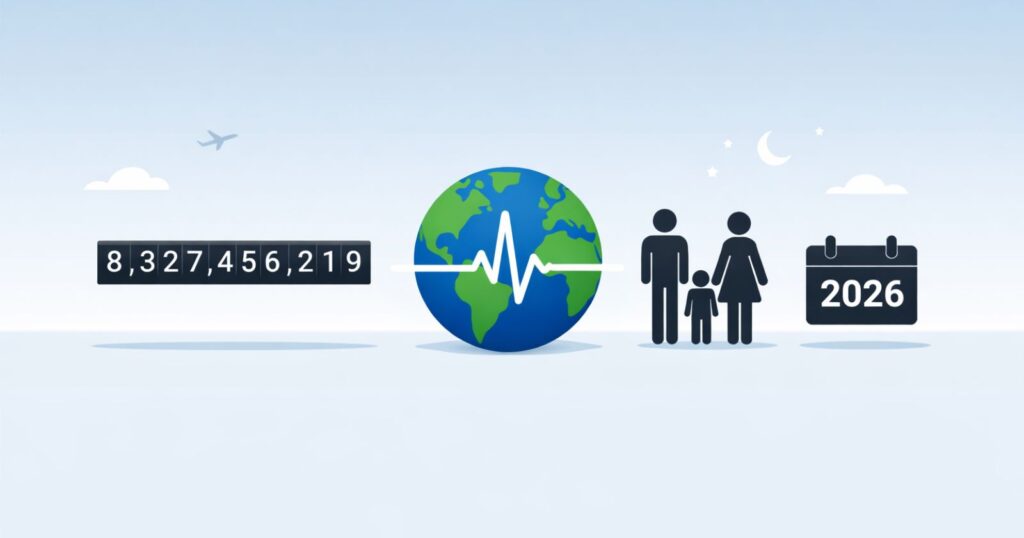
These digital counters, found on websites run by organizations like the United Nations, the U.S. Census Bureau, and independent platforms such as Worldometer, display a number that ticks upward constantly. As of early 2026, that figure stands at approximately 8.3 billion people. The clock captures the dynamic nature of global demographics, reflecting births, deaths, and migrations in near real time.
Understanding this tool reveals much about human progress. Advances in healthcare and living standards have driven explosive growth over the past century, yet recent trends show a gradual slowdown. This shift highlights evolving patterns in fertility, aging populations, and regional differences that shape the world today.
What Exactly Is the World Population Clock?
The world population clock serves as a live estimator of the total number of humans alive at any instant. Popular versions include the U.S. Census Bureau’s official tool and Worldometer’s widely viewed counter.
These clocks do not rely on instantaneous global reporting. Instead, they use sophisticated models to project changes second by second. The display creates an engaging way to visualize demographic data that would otherwise remain static in reports.
Key providers draw from authoritative sources. The United Nations Population Division releases comprehensive revisions every few years, incorporating census results, surveys, and vital records from countries worldwide. The U.S. Census Bureau maintains its International Database for similar purposes.
How the World Population Clock Operates
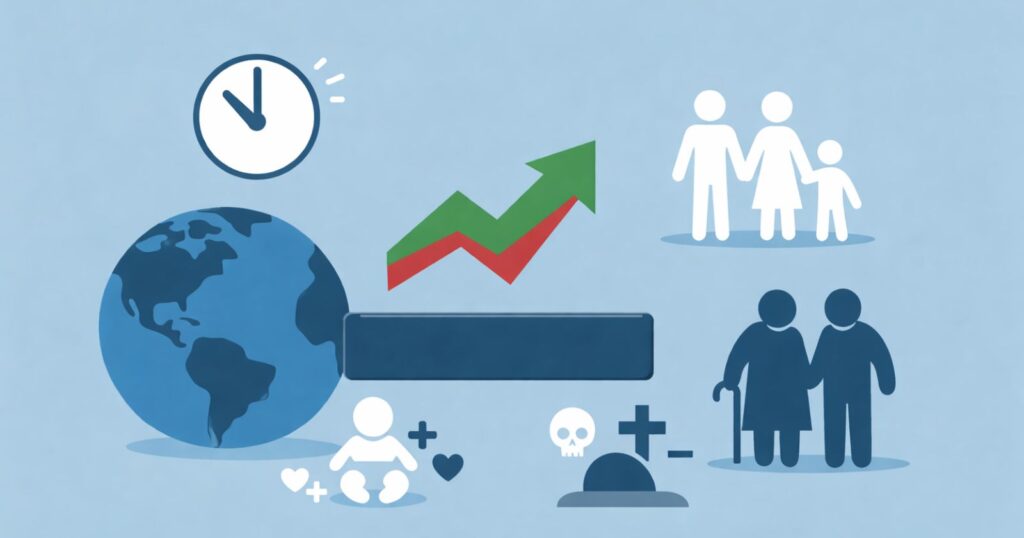
At its core, the clock calculates population changes based on three main factors: births, deaths, and net migration.
Demographers start with a baseline estimate, often a midyear figure from the latest data revision. They then apply average rates for vital events. For instance, current global averages show roughly 4 births and 2 deaths per second, leading to a net increase of about 2 people every second.
These rates come from aggregated national statistics. Birth and death rates vary by region, with higher figures in developing areas offsetting lower ones elsewhere. Migration adds another layer, though it has a smaller overall impact globally.
Data Sources and Methodology
Reliable clocks anchor in data from the United Nations World Population Prospects, the most recent being the 2024 revision. This edition analyzed over 1,900 national censuses and thousands of surveys to refine estimates.
The U.S. Census Bureau uses its International Database, projecting short-term trends from country-level data. Both approaches involve statistical modeling to fill gaps where direct counts lag.
Projections assume continuity in trends for fertility, mortality, and migration. Algorithms then interpolate changes continuously, updating the displayed total accordingly.
Why Estimates Vary Slightly
Different clocks may show minor discrepancies. For example, the exact date for reaching 8 billion ranged from 2022 to 2023, depending on the source. Such variations stem from differing assumptions and update timings.
No clock claims perfect accuracy. Events occur unevenly, and data collection takes time. The tools provide educated approximations to illustrate broader trends.
Key Milestones in World Population Growth
Humanity’s numbers have surged dramatically in modern history.
It took until around 1804 to reach 1 billion. The second billion arrived in 1927, reflecting early industrial gains. Growth accelerated postwar, hitting 3 billion in 1960, 4 billion in 1974, and 5 billion in 1987.
The pace continued with 6 billion in 1999, 7 billion in 2011, and 8 billion around 2022 or 2023. Each recent billion has taken about 11 to 15 years.
Current Figures and Growth Rate
Early 2026 estimates place the total near 8.3 billion. Annual growth adds roughly 70 to 80 million people, equating to about 0.85 percent yearly.
This rate has declined from peaks of over 2 percent in the 1960s. Falling fertility in many regions drives the slowdown.
| Milestone | Approximate Year Reached | Time to Add Previous Billion |
|---|---|---|
| 1 Billion | 1804 | All of human history |
| 2 Billion | 1927 | 123 years |
| 3 Billion | 1960 | 33 years |
| 4 Billion | 1974 | 14 years |
| 5 Billion | 1987 | 13 years |
| 6 Billion | 1999 | 12 years |
| 7 Billion | 2011 | 12 years |
| 8 Billion | 2022 | 11 years |
Regional Variations in Population Dynamics
Growth concentrates in specific areas. Asia holds over half the world’s people, led by India and China. Africa experiences the fastest expansion, with rates often exceeding 2 percent annually.
In contrast, Europe and parts of East Asia see stable or declining numbers due to low fertility. Many countries now rely on immigration to maintain workforce sizes.
Urbanization accompanies these shifts. Over half of humanity lives in cities, a figure rising steadily as people seek opportunities.
Fertility and Mortality Trends
Global fertility averages around 2.3 children per woman, down from higher levels decades ago. Sub-Saharan Africa maintains elevated rates, while East Asia and Europe fall below replacement level.
Life expectancy continues rising, reaching about 73 years worldwide. Improvements in healthcare reduce mortality, especially among children.
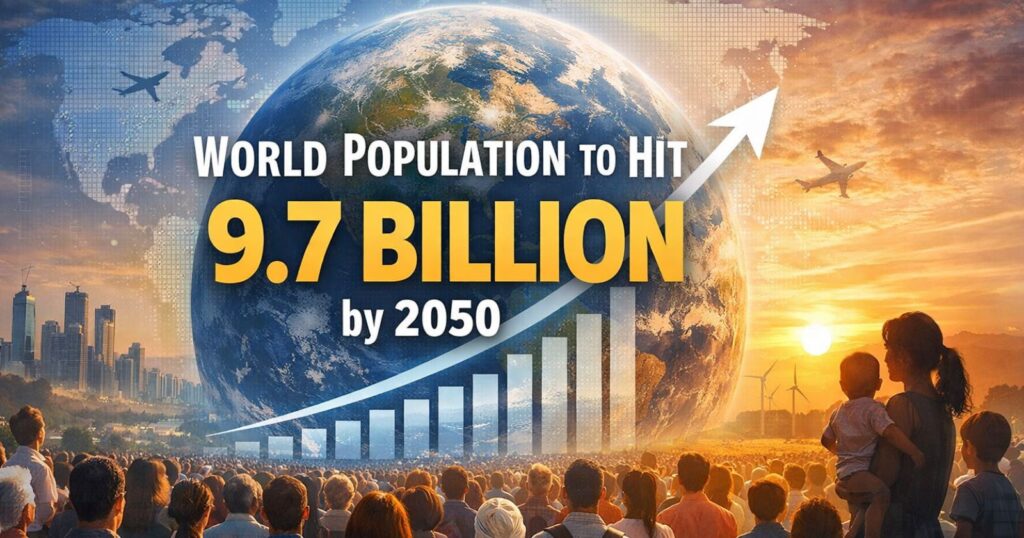
Future Projections and Peak Population
United Nations forecasts suggest growth will continue but taper. The total may reach 9.7 billion by 2050 and peak around 10.3 billion in the 2080s before a slight decline.
Factors like education, women’s empowerment, and economic development influence these paths. Lower fertility scenarios could lead to earlier peaks.
Aging populations pose new challenges. By mid-century, older adults may outnumber children in many places.
Implications for Resources and Society
Expanding numbers strain food, water, and energy supplies in some regions. Yet innovation and efficiency have historically met demands.
Sustainable practices become crucial. Balanced demographics support economic stability and environmental health.
Limitations of Population Clocks
Clocks simplify complex realities. They average events that cluster unevenly, like fewer births on weekends.
Data gaps persist in remote or conflict-affected areas. Revisions can adjust past estimates significantly.
Still, these tools educate and raise awareness effectively.
Why Track Population in Real Time?
Live counters make abstract statistics tangible. They highlight humanity’s shared trajectory and interconnectedness.
Educators, policymakers, and researchers use them to discuss trends in health, migration, and development.
Watching the numbers climb reminds everyone of ongoing changes and the need for informed planning.
Key Conclusion and Analysis
The world population clock stands as a remarkable achievement in data visualization. It transforms vast datasets into a simple, ticking number that represents all of humanity. From ancient times when counts barely reached millions to today’s 8.3 billion, the journey reflects triumphs in survival and progress.
Yet the story evolves. Growth slows as societies mature, bringing new balances between youth and age, urban and rural, abundance and constraint. Projections point to a peak later this century, followed by stabilization. This transition offers opportunities to address inequalities, protect the environment, and build resilient communities.
Accurate tracking through tools like these clocks guides better decisions. Sources such as the United Nations and U.S. Census Bureau provide the foundation, ensuring estimates remain grounded in evidence. As demographics shift, understanding these dynamics helps navigate the future thoughtfully.
Ultimately, the clock does more than count people. It underscores the collective impact of individual lives and the importance of fostering a world where everyone thrives sustainably. The numbers will keep changing, but the insights they offer endure.
Frequently Asked Questions
- What is the current world population in 2026? Estimates place it around 8.3 billion as of early 2026, based on United Nations and U.S. Census Bureau projections.
- How accurate is the world population clock? It offers close approximations using the best available data, but exact figures remain impossible due to reporting delays and uneven events.
- Who runs the most reliable population clocks? The U.S. Census Bureau and platforms like Worldometer use data from the United Nations Population Division for authoritative estimates.
- Why does the population clock tick upward constantly? Births exceed deaths globally by about two per second, driving net growth despite regional variations.
- When did the world reach 8 billion people? Sources date this milestone to 2022 or 2023, with slight differences from methodological updates.
- What causes differences between various population clocks? Variations arise from update frequencies, baseline dates, and assumptions about rates of births, deaths, and migration.
- How do demographers calculate future population projections? They model scenarios based on current fertility, mortality, and migration trends, producing medium, high, and low variants.
- Is world population growth speeding up or slowing down? It slows, with annual rates dropping from over 2 percent in the 1960s to about 0.85 percent now.
- Which regions drive most current population growth? Africa and parts of Asia contribute the majority, while Europe and some East Asian areas experience decline.
- When might the world population peak? United Nations medium projections indicate a peak of around 10.3 billion in the 2080s, followed by a gradual decline.